Immigrants from Laos vs Immigrants from Sri Lanka Disability Age 5 to 17
COMPARE
Immigrants from Laos
Immigrants from Sri Lanka
Disability Age 5 to 17
Disability Age 5 to 17 Comparison
Immigrants from Laos
Immigrants from Sri Lanka
5.8%
DISABILITY AGE 5 TO 17
3.8/ 100
METRIC RATING
232nd/ 347
METRIC RANK
5.0%
DISABILITY AGE 5 TO 17
100.0/ 100
METRIC RATING
42nd/ 347
METRIC RANK
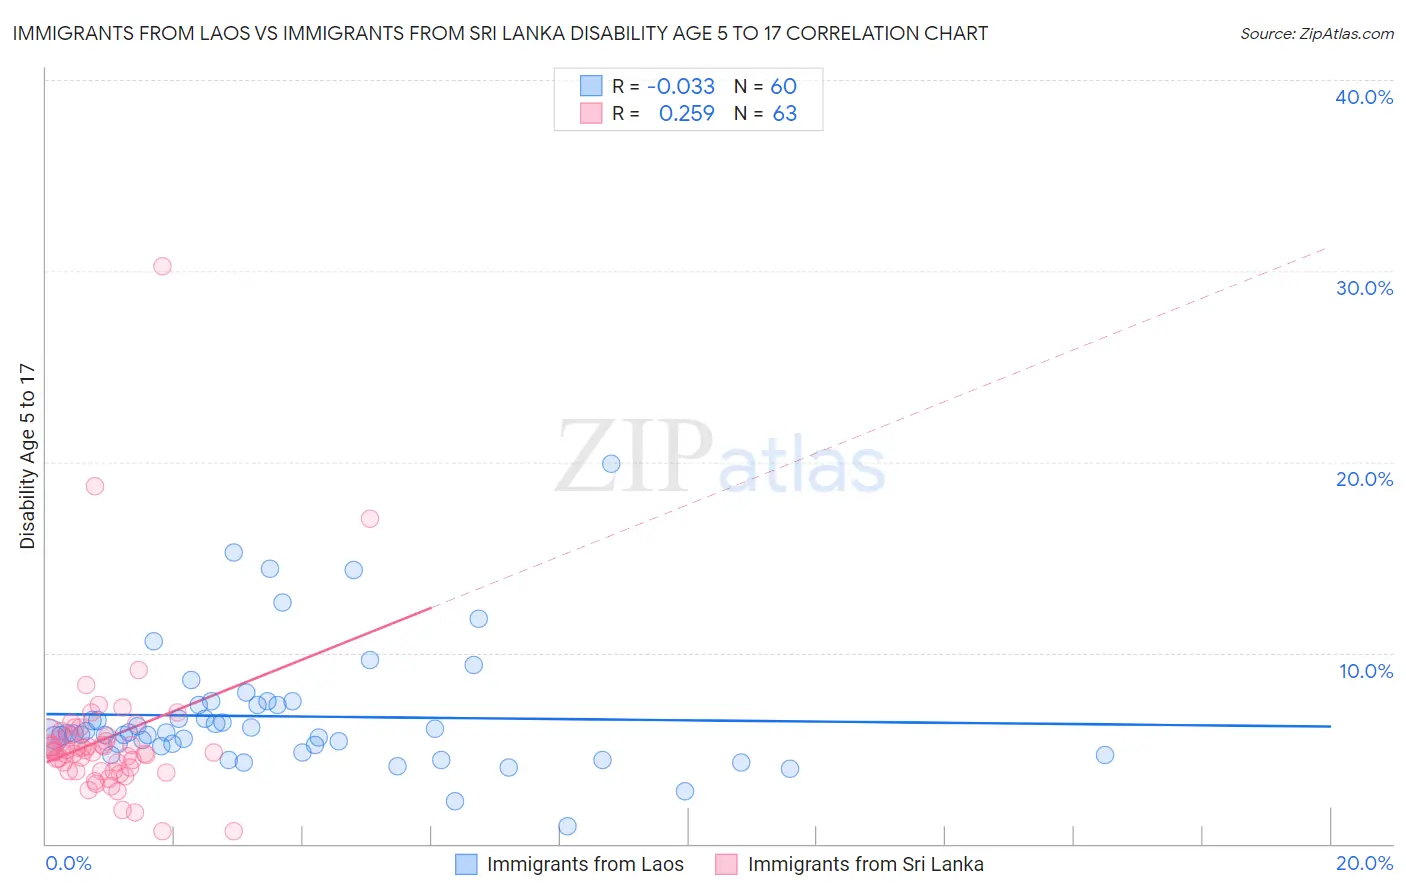
Immigrants from Laos vs Immigrants from Sri Lanka Disability Age 5 to 17 Correlation Chart
The statistical analysis conducted on geographies consisting of 200,910,190 people shows no correlation between the proportion of Immigrants from Laos and percentage of population with a disability between the ages 5 and 17 in the United States with a correlation coefficient (R) of -0.033 and weighted average of 5.8%. Similarly, the statistical analysis conducted on geographies consisting of 149,300,989 people shows a weak positive correlation between the proportion of Immigrants from Sri Lanka and percentage of population with a disability between the ages 5 and 17 in the United States with a correlation coefficient (R) of 0.259 and weighted average of 5.0%, a difference of 16.1%.
Disability Age 5 to 17 Correlation Summary
| Measurement | Immigrants from Laos | Immigrants from Sri Lanka |
| Minimum | 0.93% | 0.62% |
| Maximum | 19.9% | 30.2% |
| Range | 19.0% | 29.6% |
| Mean | 6.7% | 5.5% |
| Median | 5.8% | 4.8% |
| Interquartile 25% (IQ1) | 5.1% | 3.8% |
| Interquartile 75% (IQ3) | 7.3% | 5.7% |
| Interquartile Range (IQR) | 2.1% | 1.9% |
| Standard Deviation (Sample) | 3.3% | 4.2% |
| Standard Deviation (Population) | 3.2% | 4.2% |
Similar Demographics by Disability Age 5 to 17
Demographics Similar to Immigrants from Laos by Disability Age 5 to 17
In terms of disability age 5 to 17, the demographic groups most similar to Immigrants from Laos are Immigrants from West Indies (5.8%, a difference of 0.090%), Immigrants from Kenya (5.8%, a difference of 0.13%), Malaysian (5.8%, a difference of 0.14%), European (5.8%, a difference of 0.20%), and Immigrants from Brazil (5.8%, a difference of 0.20%).
| Demographics | Rating | Rank | Disability Age 5 to 17 |
| Guamanians/Chamorros | 5.6 /100 | #225 | Tragic 5.8% |
| British West Indians | 5.4 /100 | #226 | Tragic 5.8% |
| Swiss | 5.1 /100 | #227 | Tragic 5.8% |
| Haitians | 4.8 /100 | #228 | Tragic 5.8% |
| Bangladeshis | 4.8 /100 | #229 | Tragic 5.8% |
| Ghanaians | 4.7 /100 | #230 | Tragic 5.8% |
| Europeans | 4.5 /100 | #231 | Tragic 5.8% |
| Immigrants | Laos | 3.8 /100 | #232 | Tragic 5.8% |
| Immigrants | West Indies | 3.5 /100 | #233 | Tragic 5.8% |
| Immigrants | Kenya | 3.4 /100 | #234 | Tragic 5.8% |
| Malaysians | 3.4 /100 | #235 | Tragic 5.8% |
| Immigrants | Brazil | 3.2 /100 | #236 | Tragic 5.8% |
| Sudanese | 2.9 /100 | #237 | Tragic 5.8% |
| Hungarians | 2.6 /100 | #238 | Tragic 5.8% |
| German Russians | 2.4 /100 | #239 | Tragic 5.9% |
Demographics Similar to Immigrants from Sri Lanka by Disability Age 5 to 17
In terms of disability age 5 to 17, the demographic groups most similar to Immigrants from Sri Lanka are Immigrants from Australia (5.0%, a difference of 0.010%), Okinawan (5.0%, a difference of 0.090%), Immigrants from Philippines (5.0%, a difference of 0.17%), Immigrants from Argentina (5.0%, a difference of 0.17%), and Immigrants from Belarus (5.0%, a difference of 0.21%).
| Demographics | Rating | Rank | Disability Age 5 to 17 |
| Bolivians | 100.0 /100 | #35 | Exceptional 5.0% |
| Immigrants | Egypt | 100.0 /100 | #36 | Exceptional 5.0% |
| Immigrants | Belarus | 100.0 /100 | #37 | Exceptional 5.0% |
| Immigrants | Philippines | 100.0 /100 | #38 | Exceptional 5.0% |
| Immigrants | Argentina | 100.0 /100 | #39 | Exceptional 5.0% |
| Okinawans | 100.0 /100 | #40 | Exceptional 5.0% |
| Immigrants | Australia | 100.0 /100 | #41 | Exceptional 5.0% |
| Immigrants | Sri Lanka | 100.0 /100 | #42 | Exceptional 5.0% |
| Immigrants | Russia | 100.0 /100 | #43 | Exceptional 5.0% |
| Egyptians | 100.0 /100 | #44 | Exceptional 5.0% |
| Tongans | 100.0 /100 | #45 | Exceptional 5.0% |
| Assyrians/Chaldeans/Syriacs | 100.0 /100 | #46 | Exceptional 5.0% |
| Vietnamese | 100.0 /100 | #47 | Exceptional 5.1% |
| Koreans | 100.0 /100 | #48 | Exceptional 5.1% |
| Immigrants | Western Asia | 100.0 /100 | #49 | Exceptional 5.1% |