Yugoslavian vs Immigrants from Sri Lanka Disability Age 5 to 17
COMPARE
Yugoslavian
Immigrants from Sri Lanka
Disability Age 5 to 17
Disability Age 5 to 17 Comparison
Yugoslavians
Immigrants from Sri Lanka
5.8%
DISABILITY AGE 5 TO 17
9.1/ 100
METRIC RATING
211th/ 347
METRIC RANK
5.0%
DISABILITY AGE 5 TO 17
100.0/ 100
METRIC RATING
42nd/ 347
METRIC RANK
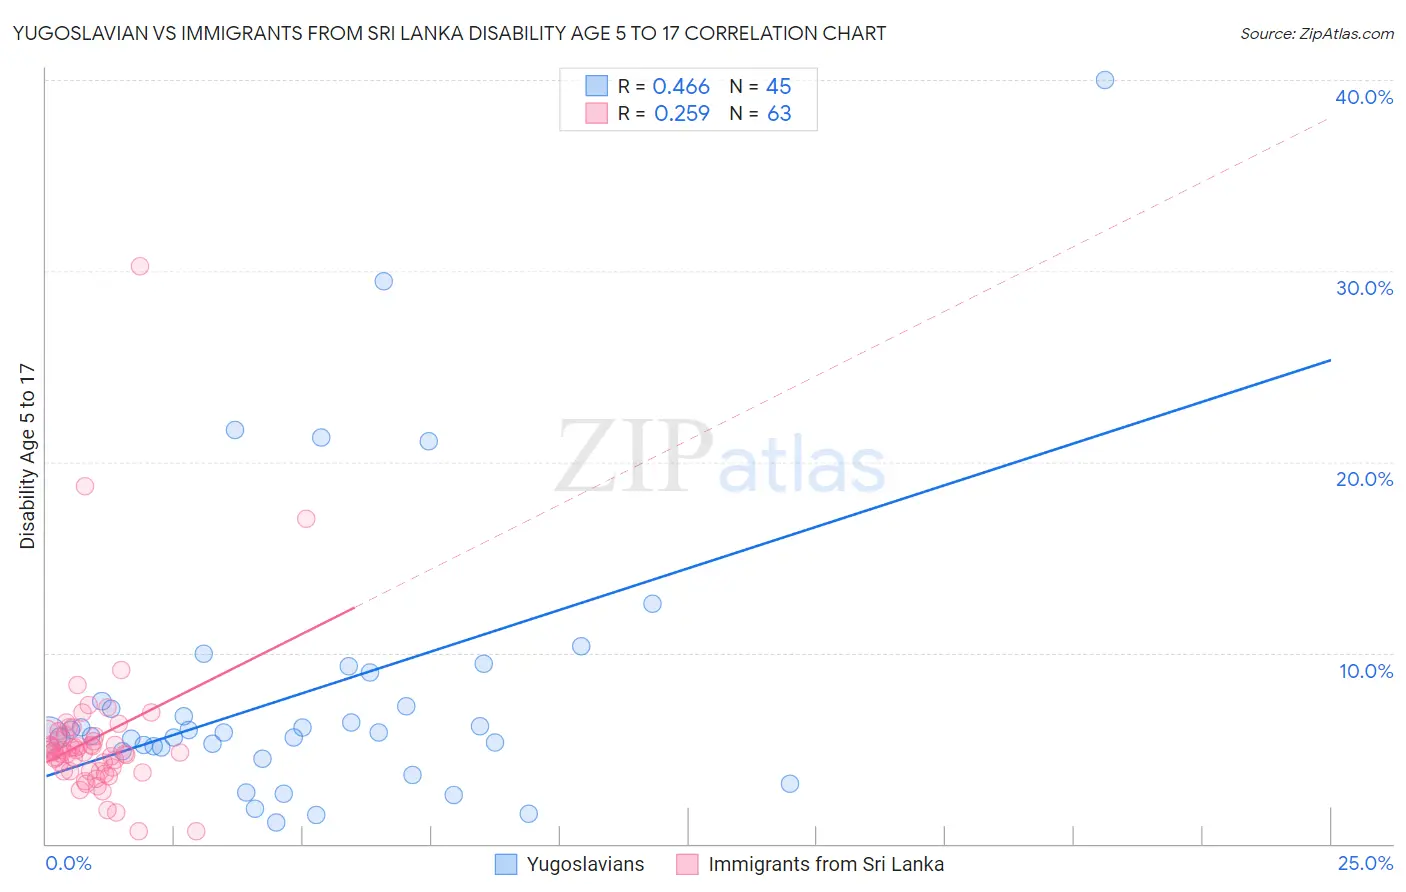
Yugoslavian vs Immigrants from Sri Lanka Disability Age 5 to 17 Correlation Chart
The statistical analysis conducted on geographies consisting of 284,028,403 people shows a moderate positive correlation between the proportion of Yugoslavians and percentage of population with a disability between the ages 5 and 17 in the United States with a correlation coefficient (R) of 0.466 and weighted average of 5.8%. Similarly, the statistical analysis conducted on geographies consisting of 149,300,989 people shows a weak positive correlation between the proportion of Immigrants from Sri Lanka and percentage of population with a disability between the ages 5 and 17 in the United States with a correlation coefficient (R) of 0.259 and weighted average of 5.0%, a difference of 14.8%.
Disability Age 5 to 17 Correlation Summary
| Measurement | Yugoslavian | Immigrants from Sri Lanka |
| Minimum | 1.1% | 0.62% |
| Maximum | 40.0% | 30.2% |
| Range | 38.9% | 29.6% |
| Mean | 8.0% | 5.5% |
| Median | 5.8% | 4.8% |
| Interquartile 25% (IQ1) | 4.9% | 3.8% |
| Interquartile 75% (IQ3) | 8.2% | 5.7% |
| Interquartile Range (IQR) | 3.3% | 1.9% |
| Standard Deviation (Sample) | 7.5% | 4.2% |
| Standard Deviation (Population) | 7.4% | 4.2% |
Similar Demographics by Disability Age 5 to 17
Demographics Similar to Yugoslavians by Disability Age 5 to 17
In terms of disability age 5 to 17, the demographic groups most similar to Yugoslavians are Immigrants from Haiti (5.8%, a difference of 0.050%), Immigrants from Panama (5.8%, a difference of 0.070%), Immigrants from Uganda (5.8%, a difference of 0.080%), Kenyan (5.8%, a difference of 0.12%), and Immigrants from Cameroon (5.8%, a difference of 0.12%).
| Demographics | Rating | Rank | Disability Age 5 to 17 |
| Paiute | 11.2 /100 | #204 | Poor 5.7% |
| Trinidadians and Tobagonians | 10.8 /100 | #205 | Poor 5.7% |
| Immigrants | Africa | 10.8 /100 | #206 | Poor 5.7% |
| Moroccans | 10.4 /100 | #207 | Poor 5.7% |
| Kenyans | 10.0 /100 | #208 | Poor 5.8% |
| Immigrants | Uganda | 9.7 /100 | #209 | Tragic 5.8% |
| Immigrants | Haiti | 9.5 /100 | #210 | Tragic 5.8% |
| Yugoslavians | 9.1 /100 | #211 | Tragic 5.8% |
| Immigrants | Panama | 8.7 /100 | #212 | Tragic 5.8% |
| Immigrants | Cameroon | 8.3 /100 | #213 | Tragic 5.8% |
| Immigrants | Morocco | 8.3 /100 | #214 | Tragic 5.8% |
| Swedes | 8.1 /100 | #215 | Tragic 5.8% |
| Nigerians | 7.5 /100 | #216 | Tragic 5.8% |
| Czechs | 7.4 /100 | #217 | Tragic 5.8% |
| Immigrants | Sierra Leone | 7.1 /100 | #218 | Tragic 5.8% |
Demographics Similar to Immigrants from Sri Lanka by Disability Age 5 to 17
In terms of disability age 5 to 17, the demographic groups most similar to Immigrants from Sri Lanka are Immigrants from Australia (5.0%, a difference of 0.010%), Okinawan (5.0%, a difference of 0.090%), Immigrants from Philippines (5.0%, a difference of 0.17%), Immigrants from Argentina (5.0%, a difference of 0.17%), and Immigrants from Belarus (5.0%, a difference of 0.21%).
| Demographics | Rating | Rank | Disability Age 5 to 17 |
| Bolivians | 100.0 /100 | #35 | Exceptional 5.0% |
| Immigrants | Egypt | 100.0 /100 | #36 | Exceptional 5.0% |
| Immigrants | Belarus | 100.0 /100 | #37 | Exceptional 5.0% |
| Immigrants | Philippines | 100.0 /100 | #38 | Exceptional 5.0% |
| Immigrants | Argentina | 100.0 /100 | #39 | Exceptional 5.0% |
| Okinawans | 100.0 /100 | #40 | Exceptional 5.0% |
| Immigrants | Australia | 100.0 /100 | #41 | Exceptional 5.0% |
| Immigrants | Sri Lanka | 100.0 /100 | #42 | Exceptional 5.0% |
| Immigrants | Russia | 100.0 /100 | #43 | Exceptional 5.0% |
| Egyptians | 100.0 /100 | #44 | Exceptional 5.0% |
| Tongans | 100.0 /100 | #45 | Exceptional 5.0% |
| Assyrians/Chaldeans/Syriacs | 100.0 /100 | #46 | Exceptional 5.0% |
| Vietnamese | 100.0 /100 | #47 | Exceptional 5.1% |
| Koreans | 100.0 /100 | #48 | Exceptional 5.1% |
| Immigrants | Western Asia | 100.0 /100 | #49 | Exceptional 5.1% |