Immigrants from Laos vs Immigrants from Sri Lanka 2nd Grade
COMPARE
Immigrants from Laos
Immigrants from Sri Lanka
2nd Grade
2nd Grade Comparison
Immigrants from Laos
Immigrants from Sri Lanka
96.7%
2ND GRADE
0.0/ 100
METRIC RATING
317th/ 347
METRIC RANK
97.9%
2ND GRADE
48.7/ 100
METRIC RATING
176th/ 347
METRIC RANK
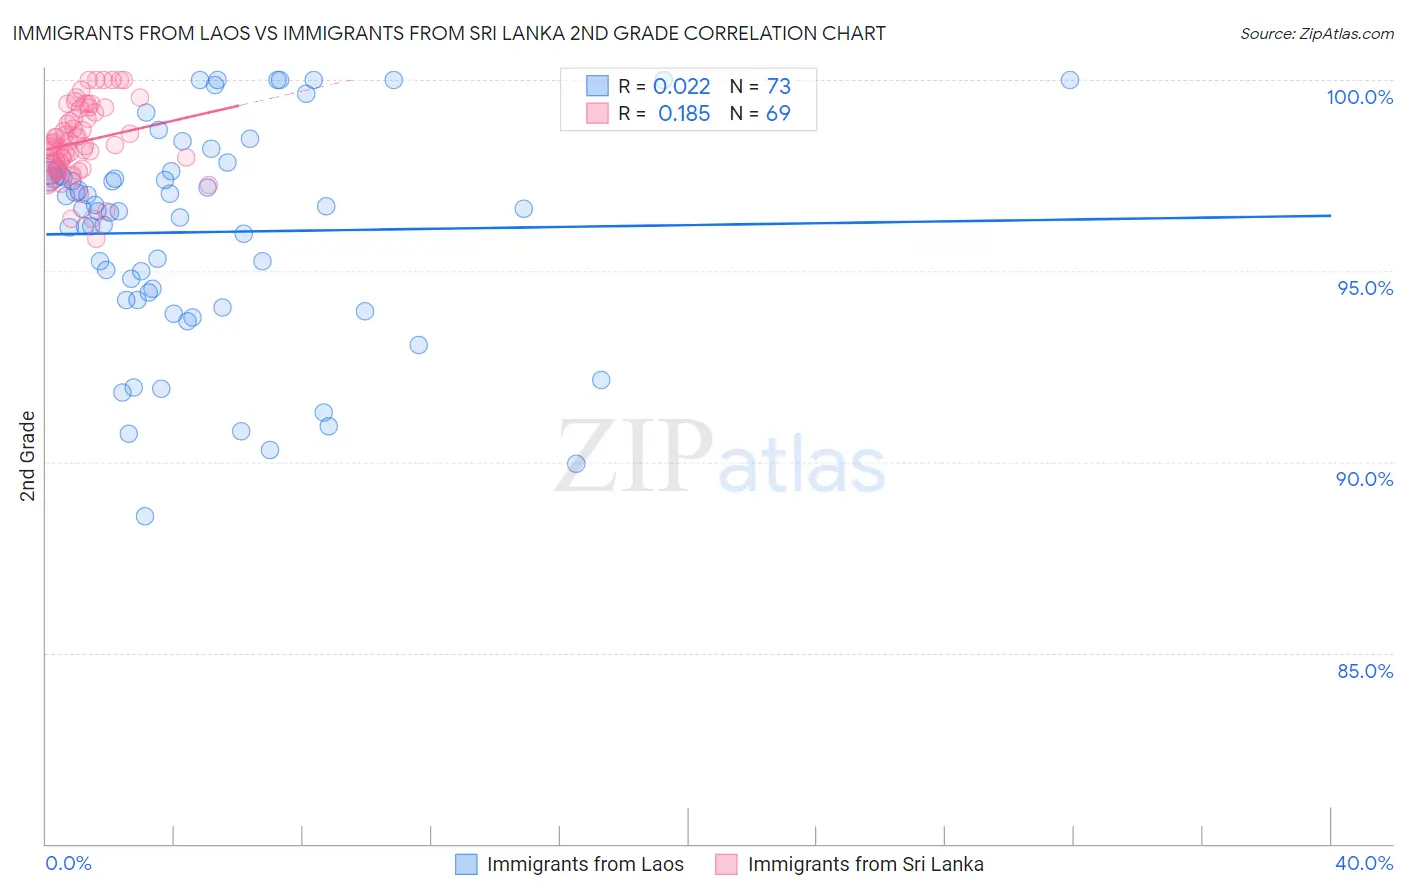
Immigrants from Laos vs Immigrants from Sri Lanka 2nd Grade Correlation Chart
The statistical analysis conducted on geographies consisting of 201,453,273 people shows no correlation between the proportion of Immigrants from Laos and percentage of population with at least 2nd grade education in the United States with a correlation coefficient (R) of 0.022 and weighted average of 96.7%. Similarly, the statistical analysis conducted on geographies consisting of 149,700,552 people shows a poor positive correlation between the proportion of Immigrants from Sri Lanka and percentage of population with at least 2nd grade education in the United States with a correlation coefficient (R) of 0.185 and weighted average of 97.9%, a difference of 1.2%.
2nd Grade Correlation Summary
| Measurement | Immigrants from Laos | Immigrants from Sri Lanka |
| Minimum | 88.6% | 95.8% |
| Maximum | 100.0% | 100.0% |
| Range | 11.4% | 4.2% |
| Mean | 96.0% | 98.4% |
| Median | 96.6% | 98.3% |
| Interquartile 25% (IQ1) | 94.2% | 97.7% |
| Interquartile 75% (IQ3) | 97.6% | 99.2% |
| Interquartile Range (IQR) | 3.4% | 1.5% |
| Standard Deviation (Sample) | 2.8% | 0.95% |
| Standard Deviation (Population) | 2.8% | 0.94% |
Similar Demographics by 2nd Grade
Demographics Similar to Immigrants from Laos by 2nd Grade
In terms of 2nd grade, the demographic groups most similar to Immigrants from Laos are Honduran (96.7%, a difference of 0.0%), Indonesian (96.7%, a difference of 0.0%), Immigrants from Nicaragua (96.7%, a difference of 0.0%), Immigrants from Belize (96.8%, a difference of 0.010%), and Immigrants from Guyana (96.7%, a difference of 0.010%).
| Demographics | Rating | Rank | 2nd Grade |
| Sri Lankans | 0.0 /100 | #310 | Tragic 96.8% |
| Guyanese | 0.0 /100 | #311 | Tragic 96.8% |
| Cape Verdeans | 0.0 /100 | #312 | Tragic 96.8% |
| Hispanics or Latinos | 0.0 /100 | #313 | Tragic 96.8% |
| Immigrants | Ecuador | 0.0 /100 | #314 | Tragic 96.8% |
| Immigrants | Belize | 0.0 /100 | #315 | Tragic 96.8% |
| Hondurans | 0.0 /100 | #316 | Tragic 96.7% |
| Immigrants | Laos | 0.0 /100 | #317 | Tragic 96.7% |
| Indonesians | 0.0 /100 | #318 | Tragic 96.7% |
| Immigrants | Nicaragua | 0.0 /100 | #319 | Tragic 96.7% |
| Immigrants | Guyana | 0.0 /100 | #320 | Tragic 96.7% |
| Immigrants | Burma/Myanmar | 0.0 /100 | #321 | Tragic 96.7% |
| Immigrants | Bangladesh | 0.0 /100 | #322 | Tragic 96.7% |
| Vietnamese | 0.0 /100 | #323 | Tragic 96.7% |
| Mexican American Indians | 0.0 /100 | #324 | Tragic 96.7% |
Demographics Similar to Immigrants from Sri Lanka by 2nd Grade
In terms of 2nd grade, the demographic groups most similar to Immigrants from Sri Lanka are Immigrants from Micronesia (97.9%, a difference of 0.0%), Immigrants from Bosnia and Herzegovina (97.9%, a difference of 0.0%), Albanian (97.9%, a difference of 0.010%), Immigrants from Korea (97.9%, a difference of 0.010%), and Kenyan (97.9%, a difference of 0.010%).
| Demographics | Rating | Rank | 2nd Grade |
| Immigrants | Spain | 55.4 /100 | #169 | Average 97.9% |
| Navajo | 54.3 /100 | #170 | Average 97.9% |
| Albanians | 52.8 /100 | #171 | Average 97.9% |
| Immigrants | Korea | 52.7 /100 | #172 | Average 97.9% |
| Kenyans | 52.7 /100 | #173 | Average 97.9% |
| Immigrants | Micronesia | 50.0 /100 | #174 | Average 97.9% |
| Immigrants | Bosnia and Herzegovina | 49.8 /100 | #175 | Average 97.9% |
| Immigrants | Sri Lanka | 48.7 /100 | #176 | Average 97.9% |
| Immigrants | Brazil | 46.6 /100 | #177 | Average 97.9% |
| Argentineans | 46.3 /100 | #178 | Average 97.9% |
| Immigrants | Venezuela | 46.1 /100 | #179 | Average 97.9% |
| Natives/Alaskans | 44.3 /100 | #180 | Average 97.9% |
| Egyptians | 44.3 /100 | #181 | Average 97.9% |
| Portuguese | 42.4 /100 | #182 | Average 97.8% |
| Immigrants | Poland | 42.2 /100 | #183 | Average 97.8% |