Immigrants from Laos vs Immigrants from Eastern Africa Disability Age 5 to 17
COMPARE
Immigrants from Laos
Immigrants from Eastern Africa
Disability Age 5 to 17
Disability Age 5 to 17 Comparison
Immigrants from Laos
Immigrants from Eastern Africa
5.8%
DISABILITY AGE 5 TO 17
3.8/ 100
METRIC RATING
232nd/ 347
METRIC RANK
5.7%
DISABILITY AGE 5 TO 17
27.3/ 100
METRIC RATING
190th/ 347
METRIC RANK
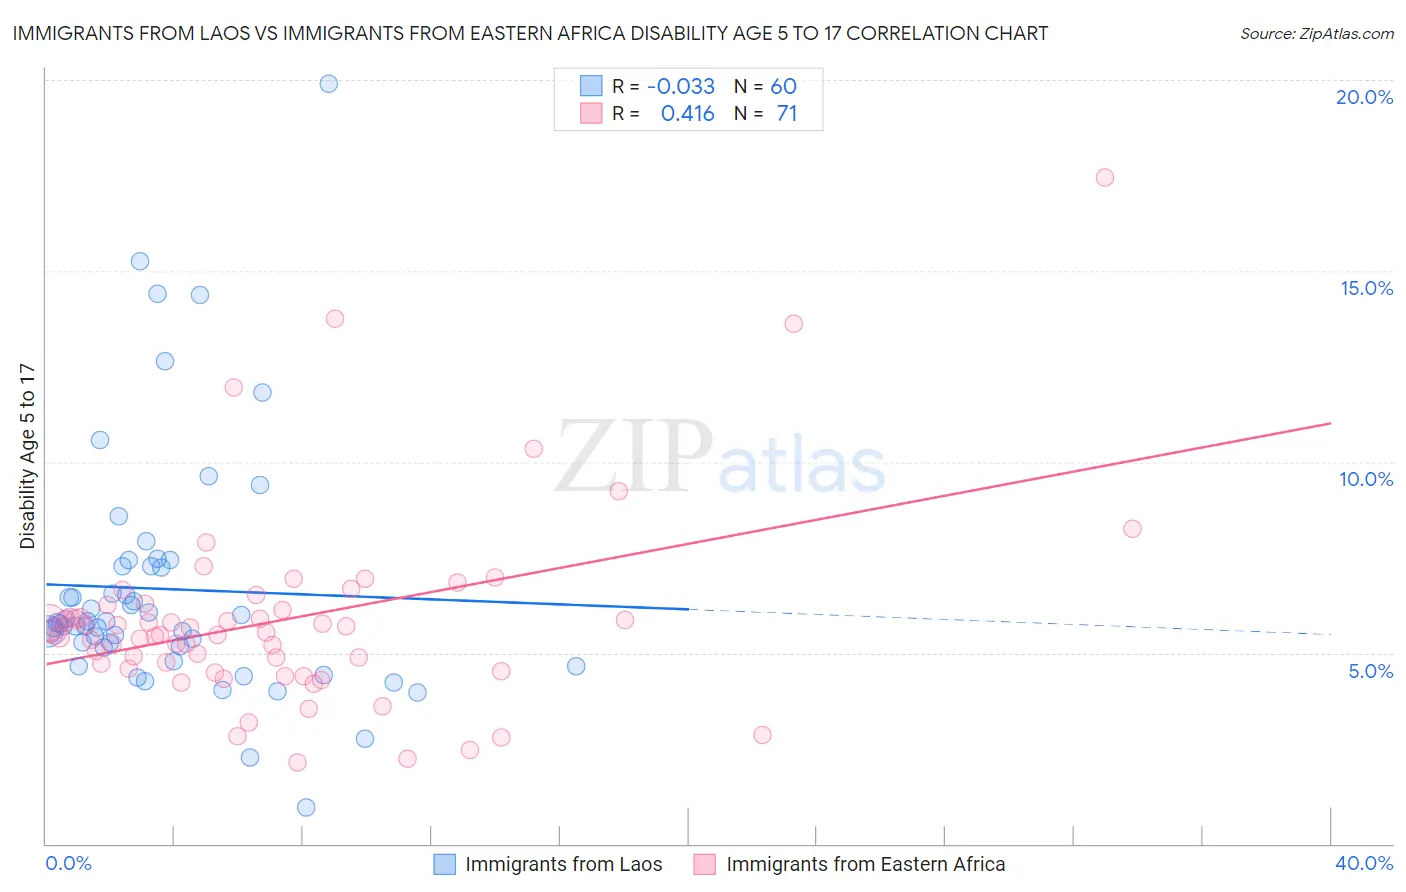
Immigrants from Laos vs Immigrants from Eastern Africa Disability Age 5 to 17 Correlation Chart
The statistical analysis conducted on geographies consisting of 200,910,190 people shows no correlation between the proportion of Immigrants from Laos and percentage of population with a disability between the ages 5 and 17 in the United States with a correlation coefficient (R) of -0.033 and weighted average of 5.8%. Similarly, the statistical analysis conducted on geographies consisting of 352,956,874 people shows a moderate positive correlation between the proportion of Immigrants from Eastern Africa and percentage of population with a disability between the ages 5 and 17 in the United States with a correlation coefficient (R) of 0.416 and weighted average of 5.7%, a difference of 2.7%.
Disability Age 5 to 17 Correlation Summary
| Measurement | Immigrants from Laos | Immigrants from Eastern Africa |
| Minimum | 0.93% | 2.1% |
| Maximum | 19.9% | 17.5% |
| Range | 19.0% | 15.3% |
| Mean | 6.7% | 5.9% |
| Median | 5.8% | 5.5% |
| Interquartile 25% (IQ1) | 5.1% | 4.6% |
| Interquartile 75% (IQ3) | 7.3% | 6.2% |
| Interquartile Range (IQR) | 2.1% | 1.7% |
| Standard Deviation (Sample) | 3.3% | 2.6% |
| Standard Deviation (Population) | 3.2% | 2.5% |
Similar Demographics by Disability Age 5 to 17
Demographics Similar to Immigrants from Laos by Disability Age 5 to 17
In terms of disability age 5 to 17, the demographic groups most similar to Immigrants from Laos are Immigrants from West Indies (5.8%, a difference of 0.090%), Immigrants from Kenya (5.8%, a difference of 0.13%), Malaysian (5.8%, a difference of 0.14%), European (5.8%, a difference of 0.20%), and Immigrants from Brazil (5.8%, a difference of 0.20%).
| Demographics | Rating | Rank | Disability Age 5 to 17 |
| Guamanians/Chamorros | 5.6 /100 | #225 | Tragic 5.8% |
| British West Indians | 5.4 /100 | #226 | Tragic 5.8% |
| Swiss | 5.1 /100 | #227 | Tragic 5.8% |
| Haitians | 4.8 /100 | #228 | Tragic 5.8% |
| Bangladeshis | 4.8 /100 | #229 | Tragic 5.8% |
| Ghanaians | 4.7 /100 | #230 | Tragic 5.8% |
| Europeans | 4.5 /100 | #231 | Tragic 5.8% |
| Immigrants | Laos | 3.8 /100 | #232 | Tragic 5.8% |
| Immigrants | West Indies | 3.5 /100 | #233 | Tragic 5.8% |
| Immigrants | Kenya | 3.4 /100 | #234 | Tragic 5.8% |
| Malaysians | 3.4 /100 | #235 | Tragic 5.8% |
| Immigrants | Brazil | 3.2 /100 | #236 | Tragic 5.8% |
| Sudanese | 2.9 /100 | #237 | Tragic 5.8% |
| Hungarians | 2.6 /100 | #238 | Tragic 5.8% |
| German Russians | 2.4 /100 | #239 | Tragic 5.9% |
Demographics Similar to Immigrants from Eastern Africa by Disability Age 5 to 17
In terms of disability age 5 to 17, the demographic groups most similar to Immigrants from Eastern Africa are Pueblo (5.7%, a difference of 0.010%), Marshallese (5.7%, a difference of 0.050%), Danish (5.7%, a difference of 0.050%), Immigrants from Bosnia and Herzegovina (5.7%, a difference of 0.060%), and Immigrants from Canada (5.7%, a difference of 0.080%).
| Demographics | Rating | Rank | Disability Age 5 to 17 |
| Immigrants | Latin America | 34.3 /100 | #183 | Fair 5.6% |
| Syrians | 33.8 /100 | #184 | Fair 5.6% |
| Immigrants | Mexico | 33.7 /100 | #185 | Fair 5.6% |
| Fijians | 31.7 /100 | #186 | Fair 5.7% |
| Immigrants | Thailand | 30.2 /100 | #187 | Fair 5.7% |
| Marshallese | 28.1 /100 | #188 | Fair 5.7% |
| Pueblo | 27.5 /100 | #189 | Fair 5.7% |
| Immigrants | Eastern Africa | 27.3 /100 | #190 | Fair 5.7% |
| Danes | 26.5 /100 | #191 | Fair 5.7% |
| Immigrants | Bosnia and Herzegovina | 26.3 /100 | #192 | Fair 5.7% |
| Immigrants | Canada | 26.1 /100 | #193 | Fair 5.7% |
| Croatians | 23.6 /100 | #194 | Fair 5.7% |
| Immigrants | Nigeria | 23.4 /100 | #195 | Fair 5.7% |
| Inupiat | 23.3 /100 | #196 | Fair 5.7% |
| Immigrants | North America | 23.1 /100 | #197 | Fair 5.7% |