Immigrants from Kenya vs Immigrants from Mexico In Labor Force | Age 30-34
COMPARE
Immigrants from Kenya
Immigrants from Mexico
In Labor Force | Age 30-34
In Labor Force | Age 30-34 Comparison
Immigrants from Kenya
Immigrants from Mexico
85.5%
IN LABOR FORCE | AGE 30-34
99.6/ 100
METRIC RATING
54th/ 347
METRIC RANK
82.0%
IN LABOR FORCE | AGE 30-34
0.0/ 100
METRIC RATING
309th/ 347
METRIC RANK
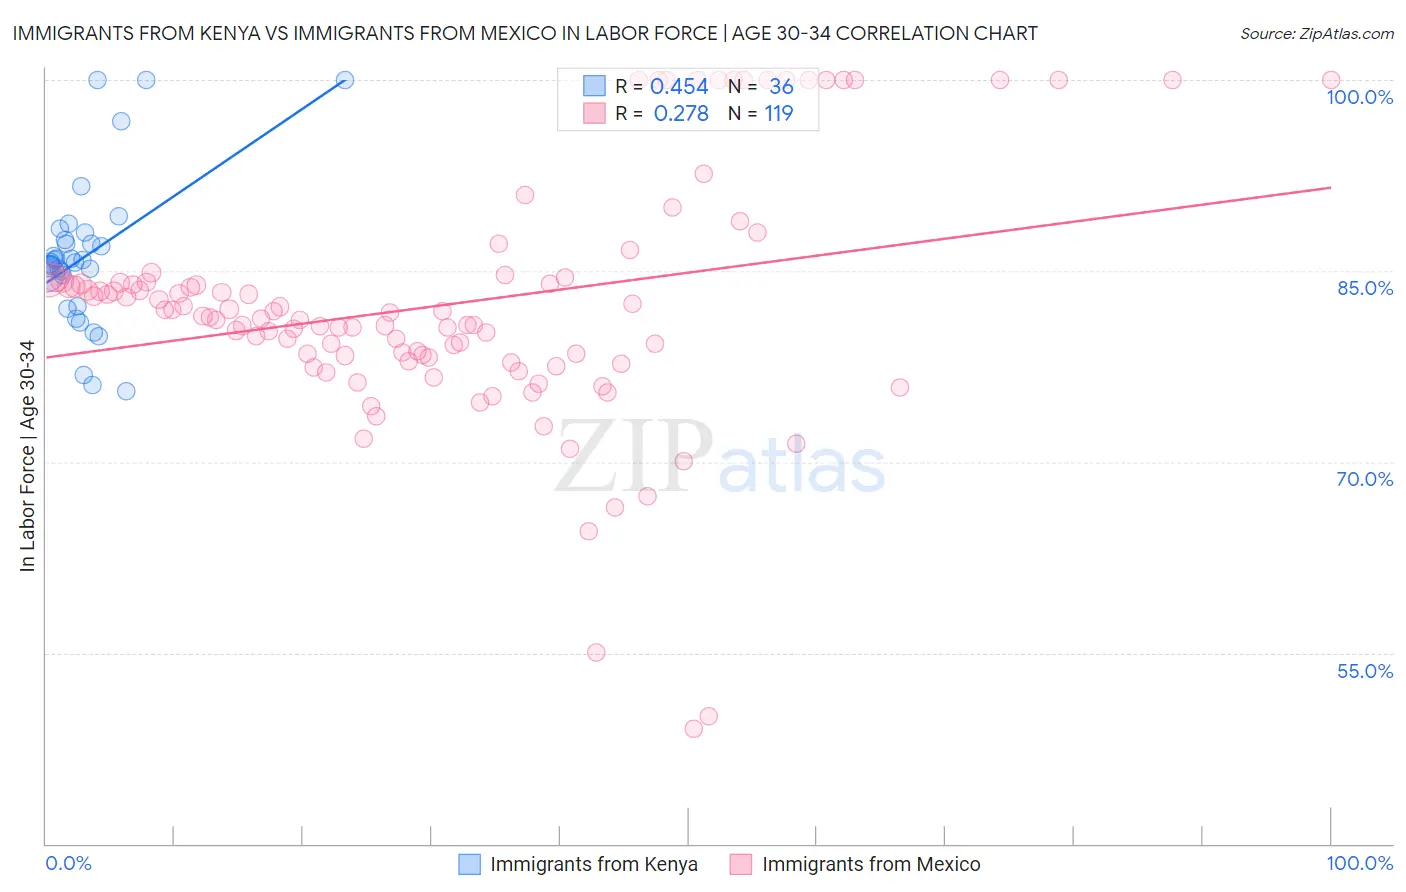
Immigrants from Kenya vs Immigrants from Mexico In Labor Force | Age 30-34 Correlation Chart
The statistical analysis conducted on geographies consisting of 217,993,590 people shows a moderate positive correlation between the proportion of Immigrants from Kenya and labor force participation rate among population between the ages 30 and 34 in the United States with a correlation coefficient (R) of 0.454 and weighted average of 85.5%. Similarly, the statistical analysis conducted on geographies consisting of 513,160,418 people shows a weak positive correlation between the proportion of Immigrants from Mexico and labor force participation rate among population between the ages 30 and 34 in the United States with a correlation coefficient (R) of 0.278 and weighted average of 82.0%, a difference of 4.3%.
In Labor Force | Age 30-34 Correlation Summary
| Measurement | Immigrants from Kenya | Immigrants from Mexico |
| Minimum | 75.5% | 49.0% |
| Maximum | 100.0% | 100.0% |
| Range | 24.5% | 51.0% |
| Mean | 86.2% | 82.4% |
| Median | 85.8% | 81.5% |
| Interquartile 25% (IQ1) | 83.5% | 78.2% |
| Interquartile 75% (IQ3) | 87.7% | 84.2% |
| Interquartile Range (IQR) | 4.3% | 6.0% |
| Standard Deviation (Sample) | 5.9% | 9.6% |
| Standard Deviation (Population) | 5.8% | 9.6% |
Similar Demographics by In Labor Force | Age 30-34
Demographics Similar to Immigrants from Kenya by In Labor Force | Age 30-34
In terms of in labor force | age 30-34, the demographic groups most similar to Immigrants from Kenya are Immigrants from Turkey (85.5%, a difference of 0.0%), Filipino (85.5%, a difference of 0.010%), Czech (85.5%, a difference of 0.010%), Russian (85.5%, a difference of 0.010%), and Polish (85.5%, a difference of 0.020%).
| Demographics | Rating | Rank | In Labor Force | Age 30-34 |
| Croatians | 99.8 /100 | #47 | Exceptional 85.6% |
| Immigrants | Sweden | 99.8 /100 | #48 | Exceptional 85.6% |
| Lithuanians | 99.8 /100 | #49 | Exceptional 85.6% |
| Immigrants | Australia | 99.8 /100 | #50 | Exceptional 85.6% |
| Cape Verdeans | 99.7 /100 | #51 | Exceptional 85.6% |
| Slovenes | 99.7 /100 | #52 | Exceptional 85.6% |
| Filipinos | 99.6 /100 | #53 | Exceptional 85.5% |
| Immigrants | Kenya | 99.6 /100 | #54 | Exceptional 85.5% |
| Immigrants | Turkey | 99.6 /100 | #55 | Exceptional 85.5% |
| Czechs | 99.6 /100 | #56 | Exceptional 85.5% |
| Russians | 99.6 /100 | #57 | Exceptional 85.5% |
| Poles | 99.6 /100 | #58 | Exceptional 85.5% |
| Immigrants | Poland | 99.5 /100 | #59 | Exceptional 85.5% |
| Immigrants | France | 99.5 /100 | #60 | Exceptional 85.5% |
| Immigrants | Brazil | 99.5 /100 | #61 | Exceptional 85.5% |
Demographics Similar to Immigrants from Mexico by In Labor Force | Age 30-34
In terms of in labor force | age 30-34, the demographic groups most similar to Immigrants from Mexico are Cajun (82.0%, a difference of 0.020%), Chickasaw (81.9%, a difference of 0.070%), Mexican (81.9%, a difference of 0.070%), Iroquois (81.9%, a difference of 0.10%), and Puget Sound Salish (82.1%, a difference of 0.16%).
| Demographics | Rating | Rank | In Labor Force | Age 30-34 |
| Ottawa | 0.0 /100 | #302 | Tragic 82.4% |
| Immigrants | Micronesia | 0.0 /100 | #303 | Tragic 82.4% |
| Tlingit-Haida | 0.0 /100 | #304 | Tragic 82.3% |
| Osage | 0.0 /100 | #305 | Tragic 82.3% |
| Spanish American Indians | 0.0 /100 | #306 | Tragic 82.2% |
| Menominee | 0.0 /100 | #307 | Tragic 82.2% |
| Puget Sound Salish | 0.0 /100 | #308 | Tragic 82.1% |
| Immigrants | Mexico | 0.0 /100 | #309 | Tragic 82.0% |
| Cajuns | 0.0 /100 | #310 | Tragic 82.0% |
| Chickasaw | 0.0 /100 | #311 | Tragic 81.9% |
| Mexicans | 0.0 /100 | #312 | Tragic 81.9% |
| Iroquois | 0.0 /100 | #313 | Tragic 81.9% |
| Alaskan Athabascans | 0.0 /100 | #314 | Tragic 81.7% |
| Cherokee | 0.0 /100 | #315 | Tragic 81.6% |
| Immigrants | Azores | 0.0 /100 | #316 | Tragic 81.5% |