Immigrants from Jordan vs Venezuelan Disability Age 5 to 17
COMPARE
Immigrants from Jordan
Venezuelan
Disability Age 5 to 17
Disability Age 5 to 17 Comparison
Immigrants from Jordan
Venezuelans
5.3%
DISABILITY AGE 5 TO 17
99.1/ 100
METRIC RATING
94th/ 347
METRIC RANK
5.4%
DISABILITY AGE 5 TO 17
92.7/ 100
METRIC RATING
133rd/ 347
METRIC RANK
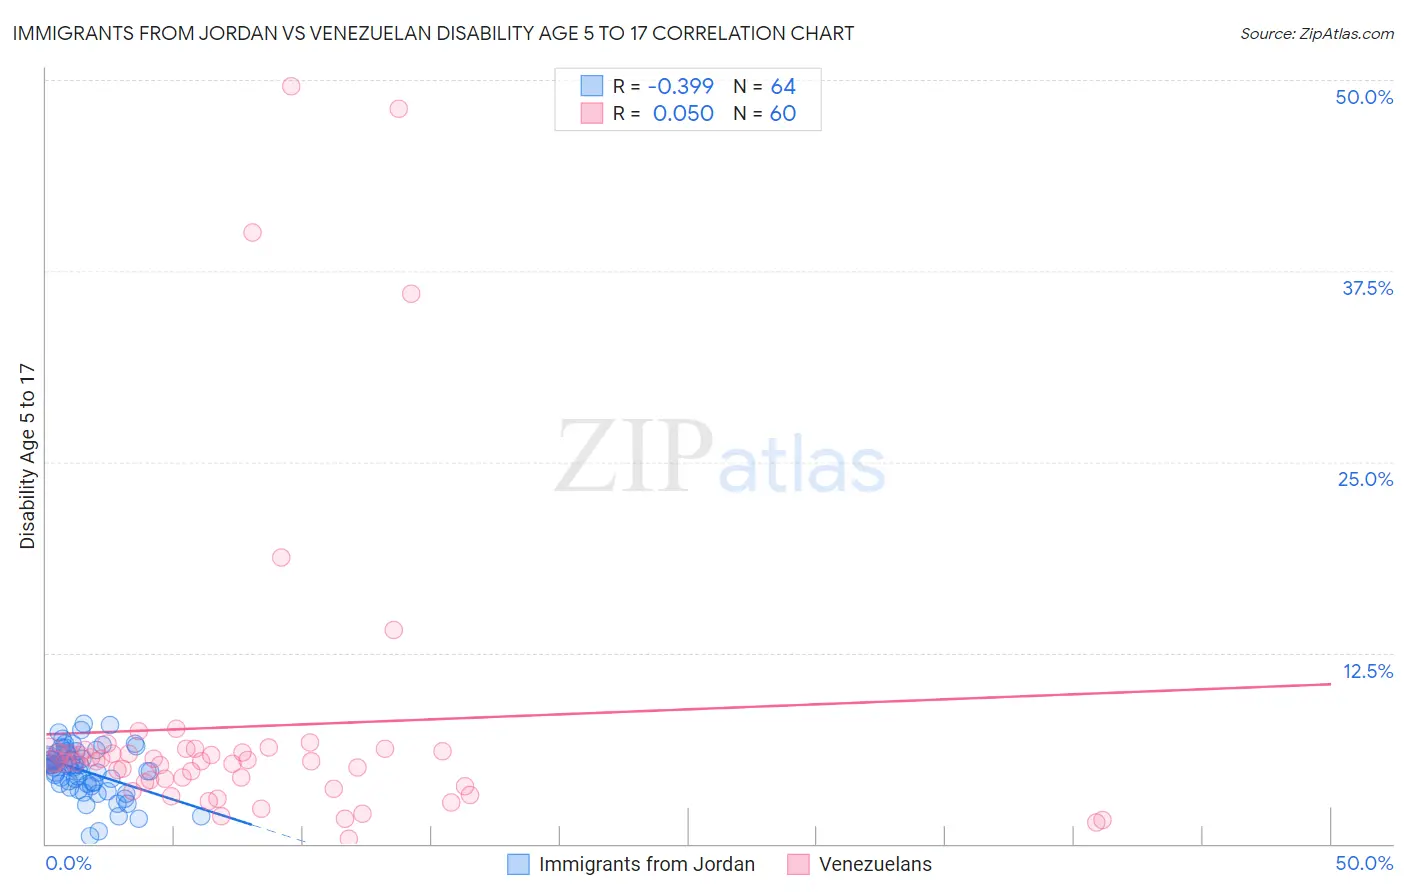
Immigrants from Jordan vs Venezuelan Disability Age 5 to 17 Correlation Chart
The statistical analysis conducted on geographies consisting of 180,773,997 people shows a mild negative correlation between the proportion of Immigrants from Jordan and percentage of population with a disability between the ages 5 and 17 in the United States with a correlation coefficient (R) of -0.399 and weighted average of 5.3%. Similarly, the statistical analysis conducted on geographies consisting of 304,670,804 people shows no correlation between the proportion of Venezuelans and percentage of population with a disability between the ages 5 and 17 in the United States with a correlation coefficient (R) of 0.050 and weighted average of 5.4%, a difference of 2.8%.
Disability Age 5 to 17 Correlation Summary
| Measurement | Immigrants from Jordan | Venezuelan |
| Minimum | 0.46% | 0.36% |
| Maximum | 7.9% | 49.6% |
| Range | 7.4% | 49.2% |
| Mean | 4.7% | 7.7% |
| Median | 5.0% | 5.4% |
| Interquartile 25% (IQ1) | 3.8% | 3.9% |
| Interquartile 75% (IQ3) | 5.9% | 6.1% |
| Interquartile Range (IQR) | 2.1% | 2.2% |
| Standard Deviation (Sample) | 1.6% | 10.1% |
| Standard Deviation (Population) | 1.6% | 10.0% |
Similar Demographics by Disability Age 5 to 17
Demographics Similar to Immigrants from Jordan by Disability Age 5 to 17
In terms of disability age 5 to 17, the demographic groups most similar to Immigrants from Jordan are Immigrants from Grenada (5.3%, a difference of 0.020%), Immigrants from Peru (5.3%, a difference of 0.070%), Luxembourger (5.3%, a difference of 0.14%), Mongolian (5.3%, a difference of 0.16%), and Immigrants from El Salvador (5.3%, a difference of 0.18%).
| Demographics | Rating | Rank | Disability Age 5 to 17 |
| Eastern Europeans | 99.4 /100 | #87 | Exceptional 5.2% |
| Immigrants | Croatia | 99.4 /100 | #88 | Exceptional 5.2% |
| Immigrants | Spain | 99.4 /100 | #89 | Exceptional 5.2% |
| Immigrants | Kuwait | 99.4 /100 | #90 | Exceptional 5.3% |
| Mongolians | 99.2 /100 | #91 | Exceptional 5.3% |
| Luxembourgers | 99.2 /100 | #92 | Exceptional 5.3% |
| Immigrants | Peru | 99.1 /100 | #93 | Exceptional 5.3% |
| Immigrants | Jordan | 99.1 /100 | #94 | Exceptional 5.3% |
| Immigrants | Grenada | 99.1 /100 | #95 | Exceptional 5.3% |
| Immigrants | El Salvador | 99.0 /100 | #96 | Exceptional 5.3% |
| Immigrants | Europe | 99.0 /100 | #97 | Exceptional 5.3% |
| Immigrants | Austria | 98.9 /100 | #98 | Exceptional 5.3% |
| Cambodians | 98.8 /100 | #99 | Exceptional 5.3% |
| Nepalese | 98.7 /100 | #100 | Exceptional 5.3% |
| Menominee | 98.7 /100 | #101 | Exceptional 5.3% |
Demographics Similar to Venezuelans by Disability Age 5 to 17
In terms of disability age 5 to 17, the demographic groups most similar to Venezuelans are Immigrants from Colombia (5.4%, a difference of 0.030%), Arab (5.4%, a difference of 0.050%), Yuman (5.4%, a difference of 0.080%), Immigrants from Belize (5.4%, a difference of 0.17%), and Immigrants from Denmark (5.4%, a difference of 0.22%).
| Demographics | Rating | Rank | Disability Age 5 to 17 |
| New Zealanders | 95.0 /100 | #126 | Exceptional 5.4% |
| Latvians | 95.0 /100 | #127 | Exceptional 5.4% |
| Immigrants | Venezuela | 94.5 /100 | #128 | Exceptional 5.4% |
| Romanians | 94.1 /100 | #129 | Exceptional 5.4% |
| Immigrants | Bulgaria | 94.0 /100 | #130 | Exceptional 5.4% |
| Arabs | 92.9 /100 | #131 | Exceptional 5.4% |
| Immigrants | Colombia | 92.9 /100 | #132 | Exceptional 5.4% |
| Venezuelans | 92.7 /100 | #133 | Exceptional 5.4% |
| Yuman | 92.3 /100 | #134 | Exceptional 5.4% |
| Immigrants | Belize | 91.7 /100 | #135 | Exceptional 5.4% |
| Immigrants | Denmark | 91.4 /100 | #136 | Exceptional 5.4% |
| Navajo | 90.9 /100 | #137 | Exceptional 5.4% |
| Immigrants | Oceania | 90.8 /100 | #138 | Exceptional 5.4% |
| Belizeans | 90.8 /100 | #139 | Exceptional 5.4% |
| Immigrants | Netherlands | 90.5 /100 | #140 | Exceptional 5.4% |