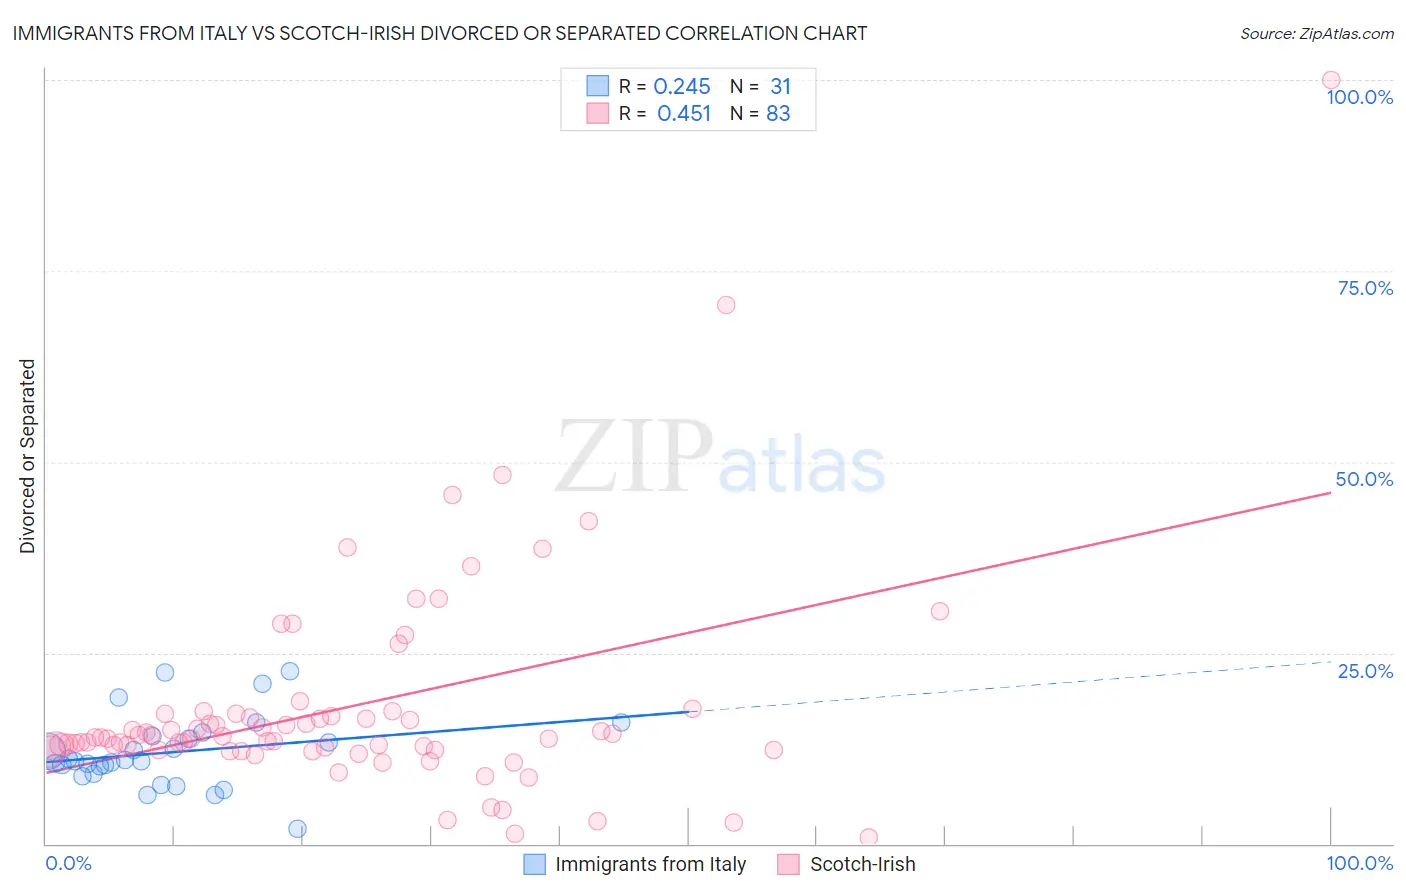
Immigrants from Italy vs Scotch-Irish Divorced or Separated
COMPARE
Immigrants from Italy
Scotch-Irish
Divorced or Separated
Divorced or Separated Comparison
Immigrants from Italy
Scotch-Irish
11.5%
DIVORCED OR SEPARATED
99.5/ 100
METRIC RATING
77th/ 347
METRIC RANK
12.9%
DIVORCED OR SEPARATED
0.0/ 100
METRIC RATING
292nd/ 347
METRIC RANK
Immigrants from Italy vs Scotch-Irish Divorced or Separated Correlation Chart
The statistical analysis conducted on geographies consisting of 324,175,792 people shows a weak positive correlation between the proportion of Immigrants from Italy and percentage of population currently divorced or separated in the United States with a correlation coefficient (R) of 0.245 and weighted average of 11.5%. Similarly, the statistical analysis conducted on geographies consisting of 548,485,641 people shows a moderate positive correlation between the proportion of Scotch-Irish and percentage of population currently divorced or separated in the United States with a correlation coefficient (R) of 0.451 and weighted average of 12.9%, a difference of 12.2%.
Divorced or Separated Correlation Summary
| Measurement | Immigrants from Italy | Scotch-Irish |
| Minimum | 2.0% | 0.80% |
| Maximum | 22.6% | 100.0% |
| Range | 20.6% | 99.2% |
| Mean | 12.0% | 17.9% |
| Median | 10.8% | 13.9% |
| Interquartile 25% (IQ1) | 9.2% | 12.3% |
| Interquartile 75% (IQ3) | 14.1% | 17.0% |
| Interquartile Range (IQR) | 4.9% | 4.7% |
| Standard Deviation (Sample) | 4.7% | 14.3% |
| Standard Deviation (Population) | 4.6% | 14.2% |
Similar Demographics by Divorced or Separated
Demographics Similar to Immigrants from Italy by Divorced or Separated
In terms of divorced or separated, the demographic groups most similar to Immigrants from Italy are Afghan (11.5%, a difference of 0.10%), Albanian (11.5%, a difference of 0.11%), Immigrants from Northern Africa (11.5%, a difference of 0.13%), Guyanese (11.5%, a difference of 0.14%), and Immigrants from Switzerland (11.5%, a difference of 0.16%).
| Demographics | Rating | Rank | Divorced or Separated |
| Immigrants | Eastern Europe | 99.7 /100 | #70 | Exceptional 11.5% |
| Paraguayans | 99.7 /100 | #71 | Exceptional 11.5% |
| Jordanians | 99.6 /100 | #72 | Exceptional 11.5% |
| Immigrants | North Macedonia | 99.6 /100 | #73 | Exceptional 11.5% |
| Taiwanese | 99.6 /100 | #74 | Exceptional 11.5% |
| Immigrants | Northern Africa | 99.6 /100 | #75 | Exceptional 11.5% |
| Albanians | 99.6 /100 | #76 | Exceptional 11.5% |
| Immigrants | Italy | 99.5 /100 | #77 | Exceptional 11.5% |
| Afghans | 99.4 /100 | #78 | Exceptional 11.5% |
| Guyanese | 99.4 /100 | #79 | Exceptional 11.5% |
| Immigrants | Switzerland | 99.4 /100 | #80 | Exceptional 11.5% |
| Russians | 99.4 /100 | #81 | Exceptional 11.5% |
| Immigrants | Romania | 99.3 /100 | #82 | Exceptional 11.5% |
| Immigrants | Bulgaria | 99.3 /100 | #83 | Exceptional 11.5% |
| Bulgarians | 99.3 /100 | #84 | Exceptional 11.5% |
Demographics Similar to Scotch-Irish by Divorced or Separated
In terms of divorced or separated, the demographic groups most similar to Scotch-Irish are Immigrants from Honduras (12.9%, a difference of 0.060%), Pima (12.9%, a difference of 0.17%), Jamaican (12.9%, a difference of 0.21%), Apache (12.9%, a difference of 0.24%), and Iroquois (12.9%, a difference of 0.32%).
| Demographics | Rating | Rank | Divorced or Separated |
| French | 0.1 /100 | #285 | Tragic 12.8% |
| Spanish | 0.1 /100 | #286 | Tragic 12.8% |
| Hondurans | 0.1 /100 | #287 | Tragic 12.8% |
| French Canadians | 0.1 /100 | #288 | Tragic 12.8% |
| Iroquois | 0.0 /100 | #289 | Tragic 12.9% |
| Pima | 0.0 /100 | #290 | Tragic 12.9% |
| Immigrants | Honduras | 0.0 /100 | #291 | Tragic 12.9% |
| Scotch-Irish | 0.0 /100 | #292 | Tragic 12.9% |
| Jamaicans | 0.0 /100 | #293 | Tragic 12.9% |
| Apache | 0.0 /100 | #294 | Tragic 12.9% |
| Celtics | 0.0 /100 | #295 | Tragic 13.0% |
| Nicaraguans | 0.0 /100 | #296 | Tragic 13.0% |
| Natives/Alaskans | 0.0 /100 | #297 | Tragic 13.0% |
| Venezuelans | 0.0 /100 | #298 | Tragic 13.0% |
| Immigrants | Jamaica | 0.0 /100 | #299 | Tragic 13.0% |