Immigrants from Italy vs Scotch-Irish 7th Grade
COMPARE
Immigrants from Italy
Scotch-Irish
7th Grade
7th Grade Comparison
Immigrants from Italy
Scotch-Irish
96.1%
7TH GRADE
62.1/ 100
METRIC RATING
164th/ 347
METRIC RANK
97.4%
7TH GRADE
100.0/ 100
METRIC RATING
26th/ 347
METRIC RANK
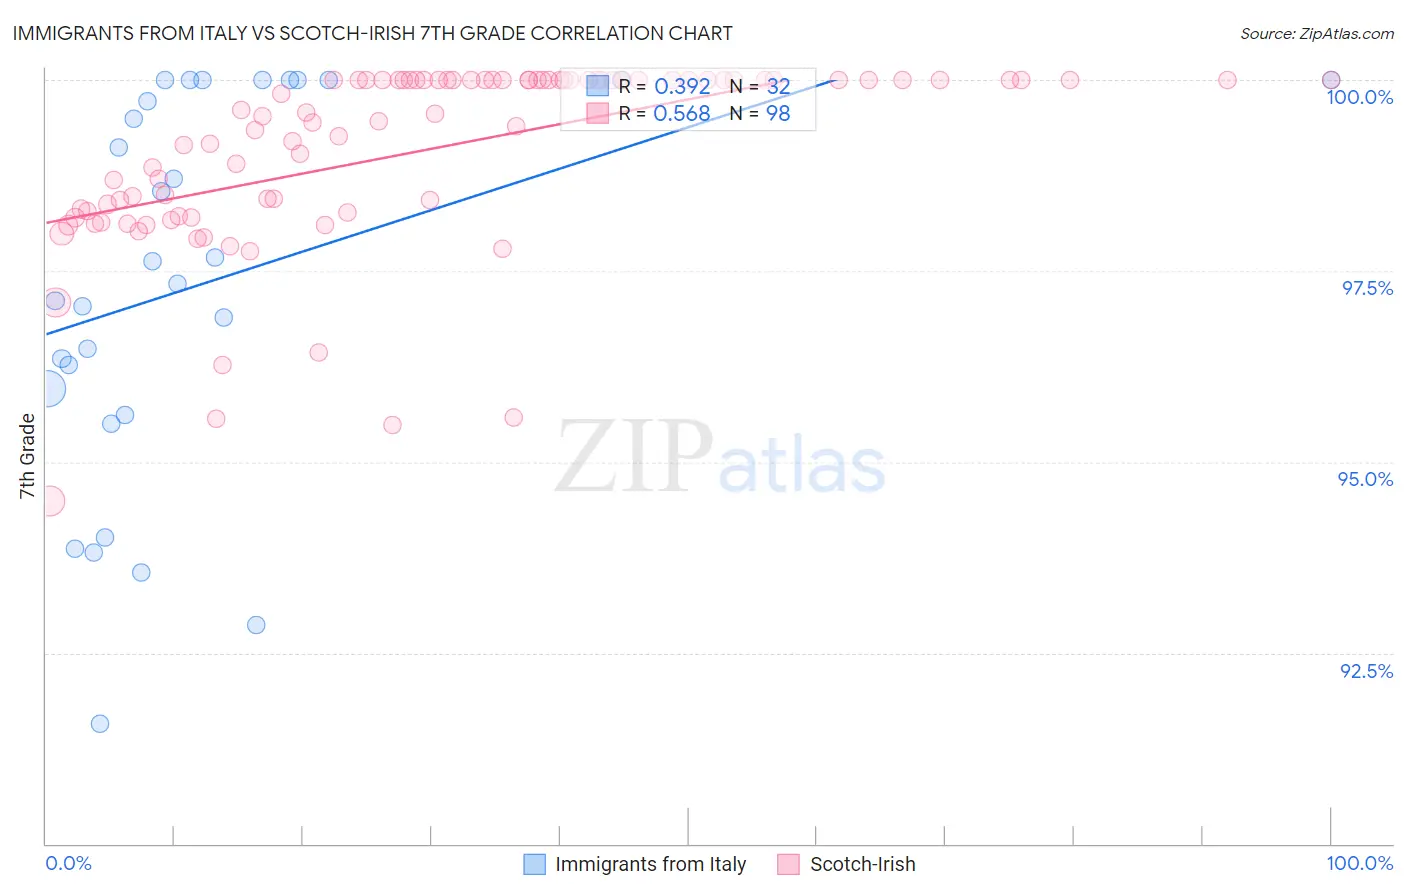
Immigrants from Italy vs Scotch-Irish 7th Grade Correlation Chart
The statistical analysis conducted on geographies consisting of 324,226,009 people shows a mild positive correlation between the proportion of Immigrants from Italy and percentage of population with at least 7th grade education in the United States with a correlation coefficient (R) of 0.392 and weighted average of 96.1%. Similarly, the statistical analysis conducted on geographies consisting of 548,777,407 people shows a substantial positive correlation between the proportion of Scotch-Irish and percentage of population with at least 7th grade education in the United States with a correlation coefficient (R) of 0.568 and weighted average of 97.4%, a difference of 1.3%.
7th Grade Correlation Summary
| Measurement | Immigrants from Italy | Scotch-Irish |
| Minimum | 91.6% | 94.5% |
| Maximum | 100.0% | 100.0% |
| Range | 8.4% | 5.5% |
| Mean | 97.3% | 99.1% |
| Median | 97.5% | 99.6% |
| Interquartile 25% (IQ1) | 95.8% | 98.3% |
| Interquartile 75% (IQ3) | 100.0% | 100.0% |
| Interquartile Range (IQR) | 4.2% | 1.7% |
| Standard Deviation (Sample) | 2.5% | 1.2% |
| Standard Deviation (Population) | 2.5% | 1.2% |
Similar Demographics by 7th Grade
Demographics Similar to Immigrants from Italy by 7th Grade
In terms of 7th grade, the demographic groups most similar to Immigrants from Italy are Spaniard (96.1%, a difference of 0.0%), Immigrants from Taiwan (96.1%, a difference of 0.0%), Pima (96.1%, a difference of 0.010%), Immigrants from Kazakhstan (96.1%, a difference of 0.010%), and Immigrants from Sri Lanka (96.1%, a difference of 0.010%).
| Demographics | Rating | Rank | 7th Grade |
| Ugandans | 75.5 /100 | #157 | Good 96.2% |
| Arabs | 68.6 /100 | #158 | Good 96.2% |
| Alsatians | 67.2 /100 | #159 | Good 96.1% |
| Immigrants | Kenya | 66.8 /100 | #160 | Good 96.1% |
| Bermudans | 66.3 /100 | #161 | Good 96.1% |
| Pima | 64.3 /100 | #162 | Good 96.1% |
| Spaniards | 62.6 /100 | #163 | Good 96.1% |
| Immigrants | Italy | 62.1 /100 | #164 | Good 96.1% |
| Immigrants | Taiwan | 61.5 /100 | #165 | Good 96.1% |
| Immigrants | Kazakhstan | 61.0 /100 | #166 | Good 96.1% |
| Immigrants | Sri Lanka | 59.9 /100 | #167 | Average 96.1% |
| Immigrants | Poland | 59.0 /100 | #168 | Average 96.1% |
| Ute | 55.8 /100 | #169 | Average 96.1% |
| Immigrants | Ukraine | 55.0 /100 | #170 | Average 96.1% |
| Egyptians | 54.2 /100 | #171 | Average 96.1% |
Demographics Similar to Scotch-Irish by 7th Grade
In terms of 7th grade, the demographic groups most similar to Scotch-Irish are Danish (97.4%, a difference of 0.0%), Welsh (97.4%, a difference of 0.010%), French (97.4%, a difference of 0.010%), Croatian (97.4%, a difference of 0.020%), and Sioux (97.4%, a difference of 0.020%).
| Demographics | Rating | Rank | 7th Grade |
| Lithuanians | 100.0 /100 | #19 | Exceptional 97.5% |
| Yup'ik | 100.0 /100 | #20 | Exceptional 97.4% |
| Inupiat | 100.0 /100 | #21 | Exceptional 97.4% |
| French Canadians | 100.0 /100 | #22 | Exceptional 97.4% |
| Croatians | 100.0 /100 | #23 | Exceptional 97.4% |
| Welsh | 100.0 /100 | #24 | Exceptional 97.4% |
| French | 100.0 /100 | #25 | Exceptional 97.4% |
| Scotch-Irish | 100.0 /100 | #26 | Exceptional 97.4% |
| Danes | 100.0 /100 | #27 | Exceptional 97.4% |
| Sioux | 100.0 /100 | #28 | Exceptional 97.4% |
| Scandinavians | 100.0 /100 | #29 | Exceptional 97.4% |
| Czechs | 100.0 /100 | #30 | Exceptional 97.4% |
| Europeans | 100.0 /100 | #31 | Exceptional 97.3% |
| Italians | 100.0 /100 | #32 | Exceptional 97.3% |
| Chippewa | 100.0 /100 | #33 | Exceptional 97.3% |