Immigrants from Ireland vs Immigrants from Afghanistan Male Disability
COMPARE
Immigrants from Ireland
Immigrants from Afghanistan
Male Disability
Male Disability Comparison
Immigrants from Ireland
Immigrants from Afghanistan
10.6%
MALE DISABILITY
97.9/ 100
METRIC RATING
86th/ 347
METRIC RANK
10.5%
MALE DISABILITY
99.2/ 100
METRIC RATING
67th/ 347
METRIC RANK
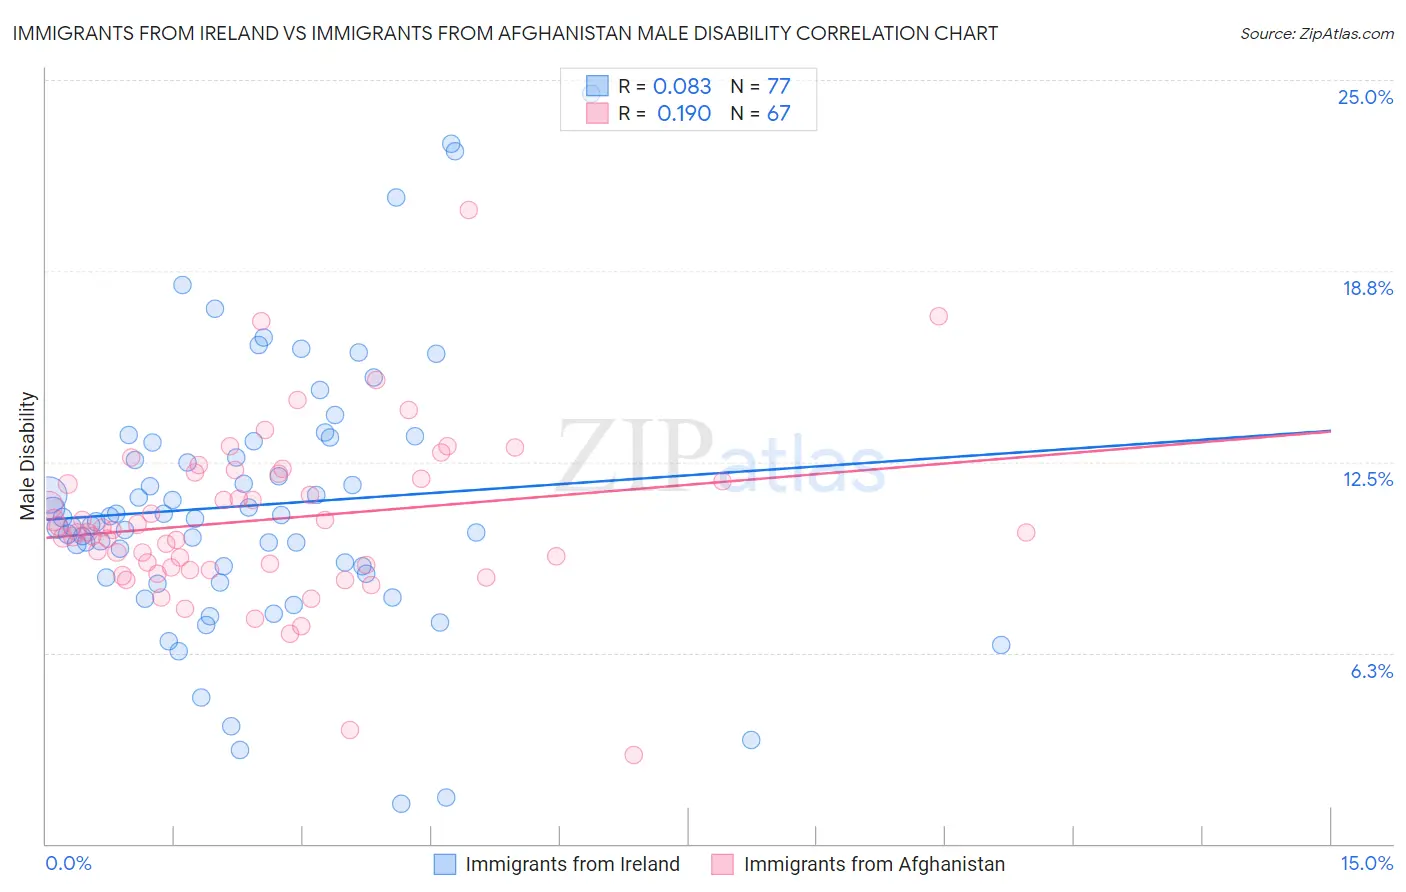
Immigrants from Ireland vs Immigrants from Afghanistan Male Disability Correlation Chart
The statistical analysis conducted on geographies consisting of 240,771,844 people shows a slight positive correlation between the proportion of Immigrants from Ireland and percentage of males with a disability in the United States with a correlation coefficient (R) of 0.083 and weighted average of 10.6%. Similarly, the statistical analysis conducted on geographies consisting of 147,637,072 people shows a poor positive correlation between the proportion of Immigrants from Afghanistan and percentage of males with a disability in the United States with a correlation coefficient (R) of 0.190 and weighted average of 10.5%, a difference of 1.5%.
Male Disability Correlation Summary
| Measurement | Immigrants from Ireland | Immigrants from Afghanistan |
| Minimum | 1.3% | 2.9% |
| Maximum | 24.5% | 20.7% |
| Range | 23.2% | 17.8% |
| Mean | 11.1% | 10.6% |
| Median | 10.6% | 10.2% |
| Interquartile 25% (IQ1) | 8.8% | 9.1% |
| Interquartile 75% (IQ3) | 13.2% | 12.1% |
| Interquartile Range (IQR) | 4.4% | 3.0% |
| Standard Deviation (Sample) | 4.4% | 2.8% |
| Standard Deviation (Population) | 4.4% | 2.7% |
Demographics Similar to Immigrants from Ireland and Immigrants from Afghanistan by Male Disability
In terms of male disability, the demographic groups most similar to Immigrants from Ireland are Sri Lankan (10.6%, a difference of 0.010%), Bulgarian (10.6%, a difference of 0.18%), Immigrants from Poland (10.6%, a difference of 0.20%), Immigrants from Guyana (10.6%, a difference of 0.26%), and Immigrants from Chile (10.6%, a difference of 0.33%). Similarly, the demographic groups most similar to Immigrants from Afghanistan are Guyanese (10.5%, a difference of 0.010%), Colombian (10.5%, a difference of 0.10%), Ecuadorian (10.5%, a difference of 0.10%), Immigrants from Bulgaria (10.5%, a difference of 0.24%), and Immigrants from Cameroon (10.5%, a difference of 0.39%).
| Demographics | Rating | Rank | Male Disability |
| Guyanese | 99.2 /100 | #66 | Exceptional 10.5% |
| Immigrants | Afghanistan | 99.2 /100 | #67 | Exceptional 10.5% |
| Colombians | 99.2 /100 | #68 | Exceptional 10.5% |
| Ecuadorians | 99.2 /100 | #69 | Exceptional 10.5% |
| Immigrants | Bulgaria | 99.1 /100 | #70 | Exceptional 10.5% |
| Immigrants | Cameroon | 99.0 /100 | #71 | Exceptional 10.5% |
| Immigrants | Serbia | 99.0 /100 | #72 | Exceptional 10.5% |
| Immigrants | Lithuania | 98.9 /100 | #73 | Exceptional 10.5% |
| Immigrants | Lebanon | 98.8 /100 | #74 | Exceptional 10.5% |
| Sierra Leoneans | 98.7 /100 | #75 | Exceptional 10.5% |
| Immigrants | Sierra Leone | 98.7 /100 | #76 | Exceptional 10.5% |
| Laotians | 98.6 /100 | #77 | Exceptional 10.6% |
| Immigrants | Russia | 98.6 /100 | #78 | Exceptional 10.6% |
| Zimbabweans | 98.4 /100 | #79 | Exceptional 10.6% |
| Immigrants | Jordan | 98.4 /100 | #80 | Exceptional 10.6% |
| Immigrants | Chile | 98.3 /100 | #81 | Exceptional 10.6% |
| Immigrants | Guyana | 98.2 /100 | #82 | Exceptional 10.6% |
| Immigrants | Poland | 98.1 /100 | #83 | Exceptional 10.6% |
| Bulgarians | 98.1 /100 | #84 | Exceptional 10.6% |
| Sri Lankans | 97.9 /100 | #85 | Exceptional 10.6% |
| Immigrants | Ireland | 97.9 /100 | #86 | Exceptional 10.6% |