Immigrants from Ireland vs Immigrants from Moldova Male Disability
COMPARE
Immigrants from Ireland
Immigrants from Moldova
Male Disability
Male Disability Comparison
Immigrants from Ireland
Immigrants from Moldova
10.6%
MALE DISABILITY
97.9/ 100
METRIC RATING
86th/ 347
METRIC RANK
11.1%
MALE DISABILITY
72.8/ 100
METRIC RATING
154th/ 347
METRIC RANK
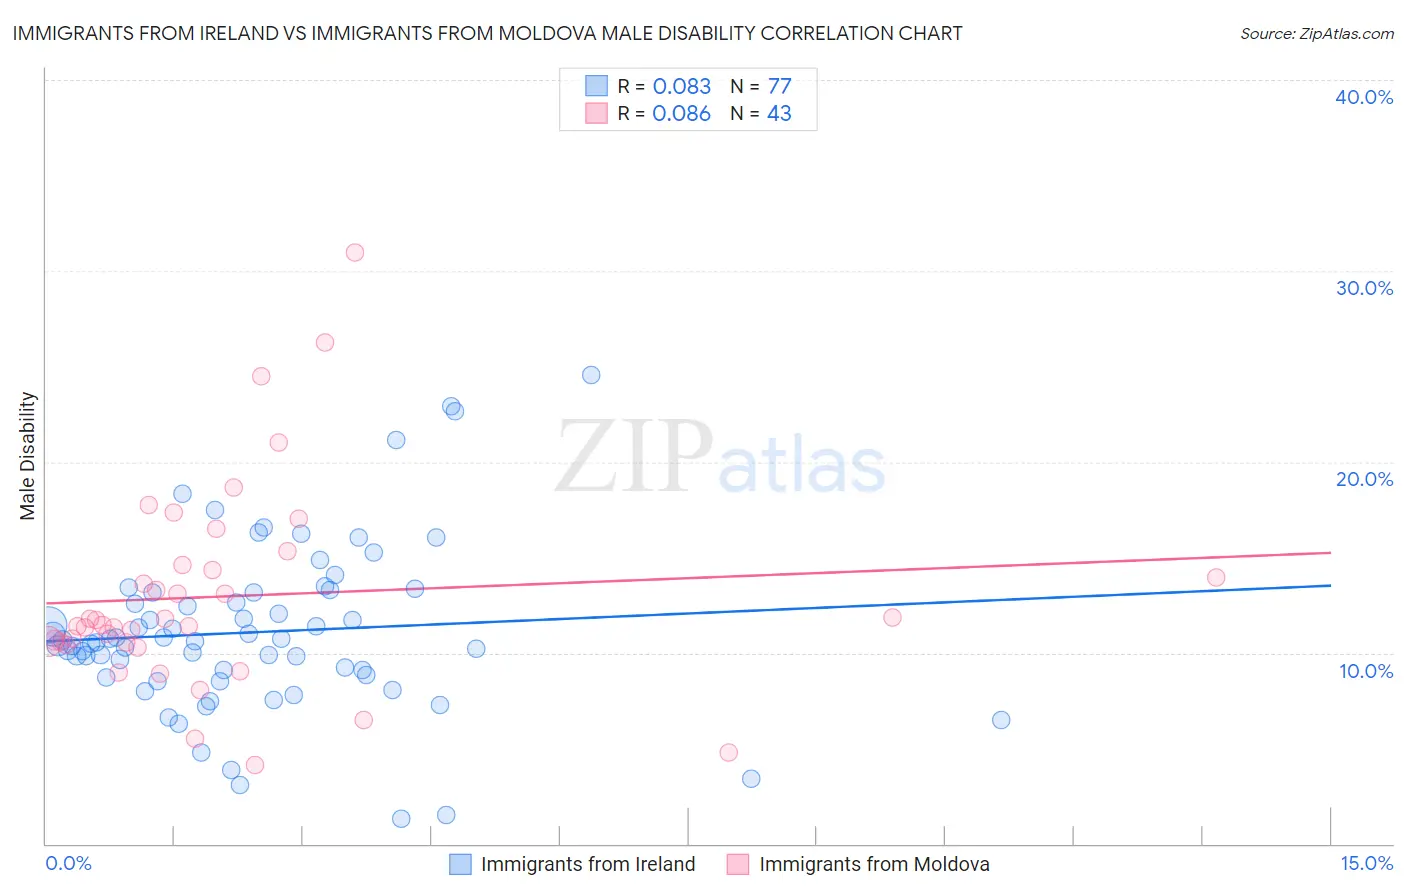
Immigrants from Ireland vs Immigrants from Moldova Male Disability Correlation Chart
The statistical analysis conducted on geographies consisting of 240,771,844 people shows a slight positive correlation between the proportion of Immigrants from Ireland and percentage of males with a disability in the United States with a correlation coefficient (R) of 0.083 and weighted average of 10.6%. Similarly, the statistical analysis conducted on geographies consisting of 124,384,403 people shows a slight positive correlation between the proportion of Immigrants from Moldova and percentage of males with a disability in the United States with a correlation coefficient (R) of 0.086 and weighted average of 11.1%, a difference of 4.2%.
Male Disability Correlation Summary
| Measurement | Immigrants from Ireland | Immigrants from Moldova |
| Minimum | 1.3% | 4.1% |
| Maximum | 24.5% | 31.0% |
| Range | 23.2% | 26.8% |
| Mean | 11.1% | 13.0% |
| Median | 10.6% | 11.5% |
| Interquartile 25% (IQ1) | 8.8% | 10.5% |
| Interquartile 75% (IQ3) | 13.2% | 14.6% |
| Interquartile Range (IQR) | 4.4% | 4.1% |
| Standard Deviation (Sample) | 4.4% | 5.3% |
| Standard Deviation (Population) | 4.4% | 5.3% |
Similar Demographics by Male Disability
Demographics Similar to Immigrants from Ireland by Male Disability
In terms of male disability, the demographic groups most similar to Immigrants from Ireland are Sri Lankan (10.6%, a difference of 0.010%), Immigrants from Vietnam (10.6%, a difference of 0.020%), Immigrants from Western Asia (10.6%, a difference of 0.090%), Immigrants from Nicaragua (10.6%, a difference of 0.090%), and Immigrants from Morocco (10.6%, a difference of 0.14%).
| Demographics | Rating | Rank | Male Disability |
| Zimbabweans | 98.4 /100 | #79 | Exceptional 10.6% |
| Immigrants | Jordan | 98.4 /100 | #80 | Exceptional 10.6% |
| Immigrants | Chile | 98.3 /100 | #81 | Exceptional 10.6% |
| Immigrants | Guyana | 98.2 /100 | #82 | Exceptional 10.6% |
| Immigrants | Poland | 98.1 /100 | #83 | Exceptional 10.6% |
| Bulgarians | 98.1 /100 | #84 | Exceptional 10.6% |
| Sri Lankans | 97.9 /100 | #85 | Exceptional 10.6% |
| Immigrants | Ireland | 97.9 /100 | #86 | Exceptional 10.6% |
| Immigrants | Vietnam | 97.9 /100 | #87 | Exceptional 10.6% |
| Immigrants | Western Asia | 97.8 /100 | #88 | Exceptional 10.6% |
| Immigrants | Nicaragua | 97.8 /100 | #89 | Exceptional 10.6% |
| Immigrants | Morocco | 97.7 /100 | #90 | Exceptional 10.6% |
| Immigrants | France | 97.6 /100 | #91 | Exceptional 10.6% |
| Palestinians | 97.4 /100 | #92 | Exceptional 10.7% |
| Immigrants | St. Vincent and the Grenadines | 97.1 /100 | #93 | Exceptional 10.7% |
Demographics Similar to Immigrants from Moldova by Male Disability
In terms of male disability, the demographic groups most similar to Immigrants from Moldova are Immigrants from Northern Europe (11.1%, a difference of 0.020%), Immigrants from Albania (11.0%, a difference of 0.11%), Immigrants from Middle Africa (11.1%, a difference of 0.14%), Cuban (11.0%, a difference of 0.15%), and Immigrants from Guatemala (11.0%, a difference of 0.17%).
| Demographics | Rating | Rank | Male Disability |
| Immigrants | Croatia | 77.3 /100 | #147 | Good 11.0% |
| Sudanese | 77.1 /100 | #148 | Good 11.0% |
| Immigrants | Denmark | 76.4 /100 | #149 | Good 11.0% |
| Immigrants | Guatemala | 75.1 /100 | #150 | Good 11.0% |
| Cubans | 74.9 /100 | #151 | Good 11.0% |
| Immigrants | Albania | 74.4 /100 | #152 | Good 11.0% |
| Immigrants | Northern Europe | 73.2 /100 | #153 | Good 11.1% |
| Immigrants | Moldova | 72.8 /100 | #154 | Good 11.1% |
| Immigrants | Middle Africa | 70.9 /100 | #155 | Good 11.1% |
| Russians | 69.8 /100 | #156 | Good 11.1% |
| Immigrants | Western Africa | 69.2 /100 | #157 | Good 11.1% |
| Latvians | 68.1 /100 | #158 | Good 11.1% |
| Guatemalans | 67.2 /100 | #159 | Good 11.1% |
| Albanians | 66.5 /100 | #160 | Good 11.1% |
| Immigrants | West Indies | 65.7 /100 | #161 | Good 11.1% |