Greek vs Immigrants from Cabo Verde Self-Care Disability
COMPARE
Greek
Immigrants from Cabo Verde
Self-Care Disability
Self-Care Disability Comparison
Greeks
Immigrants from Cabo Verde
2.4%
SELF-CARE DISABILITY
94.1/ 100
METRIC RATING
108th/ 347
METRIC RANK
3.1%
SELF-CARE DISABILITY
0.0/ 100
METRIC RATING
340th/ 347
METRIC RANK
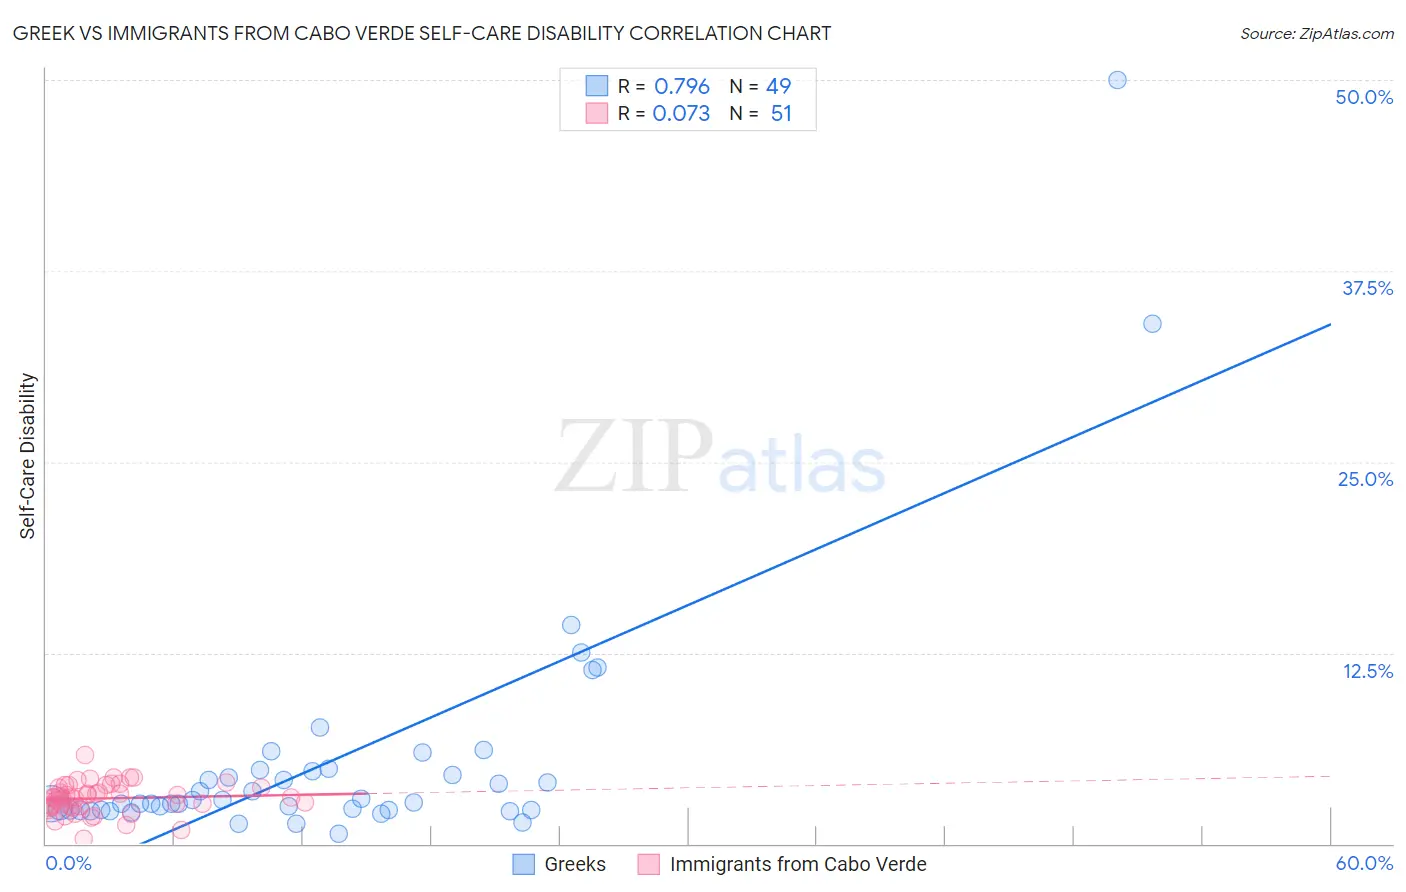
Greek vs Immigrants from Cabo Verde Self-Care Disability Correlation Chart
The statistical analysis conducted on geographies consisting of 481,876,170 people shows a strong positive correlation between the proportion of Greeks and percentage of population with self-care disability in the United States with a correlation coefficient (R) of 0.796 and weighted average of 2.4%. Similarly, the statistical analysis conducted on geographies consisting of 38,125,014 people shows a slight positive correlation between the proportion of Immigrants from Cabo Verde and percentage of population with self-care disability in the United States with a correlation coefficient (R) of 0.073 and weighted average of 3.1%, a difference of 28.1%.
Self-Care Disability Correlation Summary
| Measurement | Greek | Immigrants from Cabo Verde |
| Minimum | 0.63% | 0.30% |
| Maximum | 50.0% | 5.8% |
| Range | 49.4% | 5.5% |
| Mean | 5.5% | 3.0% |
| Median | 2.7% | 3.0% |
| Interquartile 25% (IQ1) | 2.2% | 2.4% |
| Interquartile 75% (IQ3) | 4.8% | 3.7% |
| Interquartile Range (IQR) | 2.6% | 1.2% |
| Standard Deviation (Sample) | 8.3% | 1.00% |
| Standard Deviation (Population) | 8.2% | 0.99% |
Similar Demographics by Self-Care Disability
Demographics Similar to Greeks by Self-Care Disability
In terms of self-care disability, the demographic groups most similar to Greeks are Slovene (2.4%, a difference of 0.010%), British (2.4%, a difference of 0.030%), Immigrants from Indonesia (2.4%, a difference of 0.040%), Carpatho Rusyn (2.4%, a difference of 0.050%), and Bhutanese (2.4%, a difference of 0.080%).
| Demographics | Rating | Rank | Self-Care Disability |
| Immigrants | Scotland | 95.7 /100 | #101 | Exceptional 2.4% |
| Croatians | 95.0 /100 | #102 | Exceptional 2.4% |
| Alsatians | 94.9 /100 | #103 | Exceptional 2.4% |
| Bhutanese | 94.5 /100 | #104 | Exceptional 2.4% |
| Carpatho Rusyns | 94.4 /100 | #105 | Exceptional 2.4% |
| Immigrants | Indonesia | 94.3 /100 | #106 | Exceptional 2.4% |
| British | 94.3 /100 | #107 | Exceptional 2.4% |
| Greeks | 94.1 /100 | #108 | Exceptional 2.4% |
| Slovenes | 94.1 /100 | #109 | Exceptional 2.4% |
| Immigrants | Africa | 93.7 /100 | #110 | Exceptional 2.4% |
| Serbians | 93.6 /100 | #111 | Exceptional 2.4% |
| Scandinavians | 93.5 /100 | #112 | Exceptional 2.4% |
| South Americans | 93.2 /100 | #113 | Exceptional 2.4% |
| Immigrants | North Macedonia | 93.1 /100 | #114 | Exceptional 2.4% |
| Immigrants | Hong Kong | 93.1 /100 | #115 | Exceptional 2.4% |
Demographics Similar to Immigrants from Cabo Verde by Self-Care Disability
In terms of self-care disability, the demographic groups most similar to Immigrants from Cabo Verde are Dominican (3.1%, a difference of 0.26%), Immigrants from Dominican Republic (3.0%, a difference of 0.33%), Cape Verdean (3.0%, a difference of 0.72%), Choctaw (3.0%, a difference of 1.0%), and Colville (3.1%, a difference of 1.9%).
| Demographics | Rating | Rank | Self-Care Disability |
| Dutch West Indians | 0.0 /100 | #333 | Tragic 3.0% |
| Houma | 0.0 /100 | #334 | Tragic 3.0% |
| Immigrants | Azores | 0.0 /100 | #335 | Tragic 3.0% |
| Immigrants | Yemen | 0.0 /100 | #336 | Tragic 3.0% |
| Choctaw | 0.0 /100 | #337 | Tragic 3.0% |
| Cape Verdeans | 0.0 /100 | #338 | Tragic 3.0% |
| Immigrants | Dominican Republic | 0.0 /100 | #339 | Tragic 3.0% |
| Immigrants | Cabo Verde | 0.0 /100 | #340 | Tragic 3.1% |
| Dominicans | 0.0 /100 | #341 | Tragic 3.1% |
| Colville | 0.0 /100 | #342 | Tragic 3.1% |
| Tohono O'odham | 0.0 /100 | #343 | Tragic 3.1% |
| Pueblo | 0.0 /100 | #344 | Tragic 3.3% |
| Armenians | 0.0 /100 | #345 | Tragic 3.4% |
| Puerto Ricans | 0.0 /100 | #346 | Tragic 3.7% |
| Immigrants | Armenia | 0.0 /100 | #347 | Tragic 4.2% |