Immigrants from Iraq vs Immigrants from Cabo Verde Unemployment Among Women with Children Ages 6 to 17 years
COMPARE
Immigrants from Iraq
Immigrants from Cabo Verde
Unemployment Among Women with Children Ages 6 to 17 years
Unemployment Among Women with Children Ages 6 to 17 years Comparison
Immigrants from Iraq
Immigrants from Cabo Verde
8.1%
UNEMPLOYMENT AMONG WOMEN WITH CHILDREN AGES 6 TO 17 YEARS
100.0/ 100
METRIC RATING
52nd/ 347
METRIC RANK
10.4%
UNEMPLOYMENT AMONG WOMEN WITH CHILDREN AGES 6 TO 17 YEARS
0.0/ 100
METRIC RATING
314th/ 347
METRIC RANK
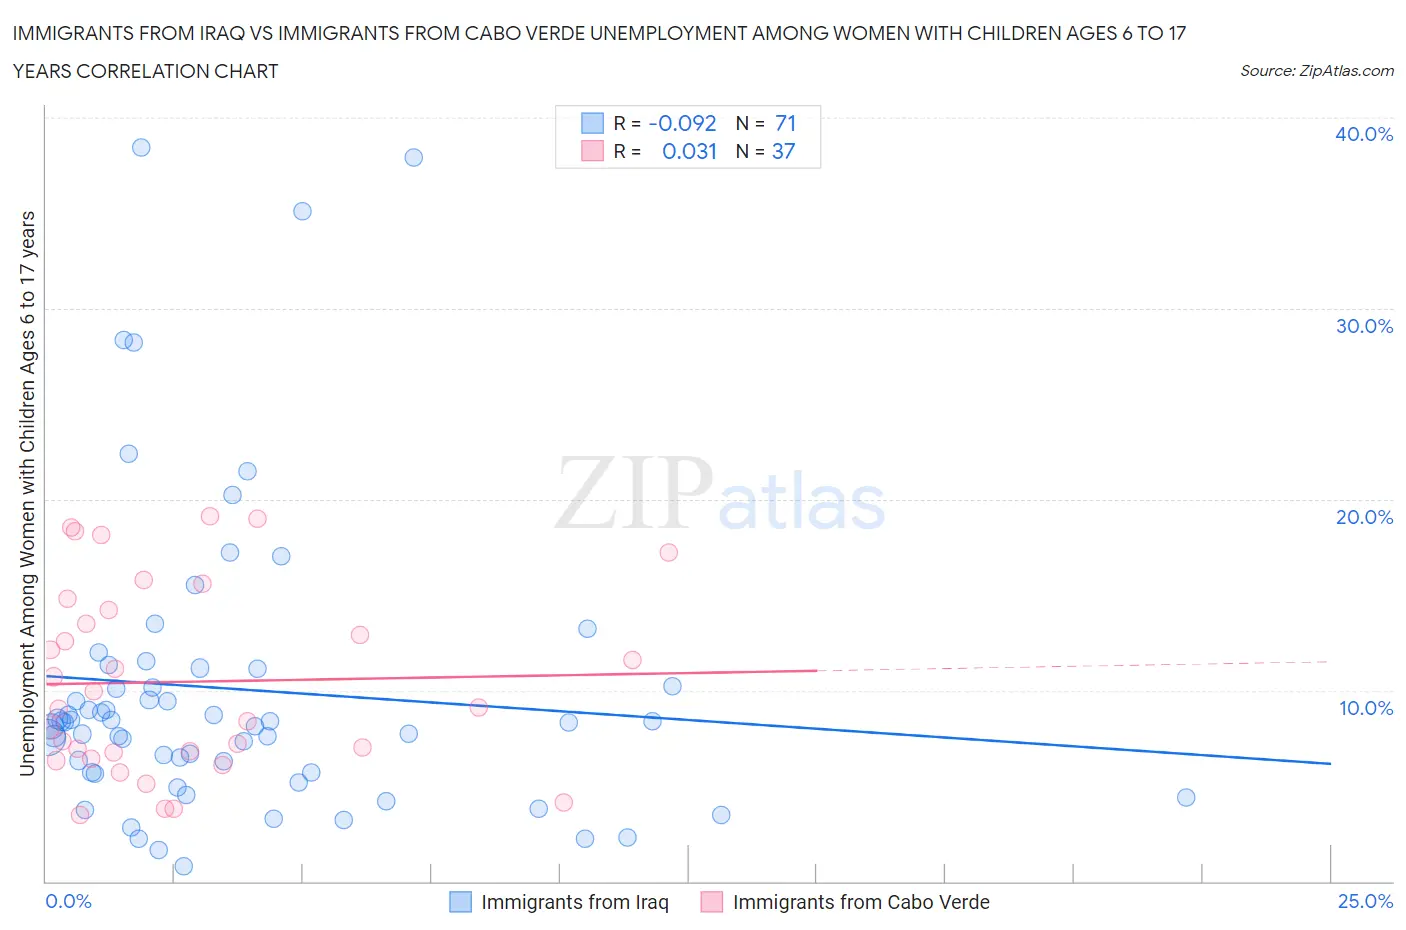
Immigrants from Iraq vs Immigrants from Cabo Verde Unemployment Among Women with Children Ages 6 to 17 years Correlation Chart
The statistical analysis conducted on geographies consisting of 158,568,400 people shows a slight negative correlation between the proportion of Immigrants from Iraq and unemployment rate among women with children between the ages 6 and 17 in the United States with a correlation coefficient (R) of -0.092 and weighted average of 8.1%. Similarly, the statistical analysis conducted on geographies consisting of 33,958,446 people shows no correlation between the proportion of Immigrants from Cabo Verde and unemployment rate among women with children between the ages 6 and 17 in the United States with a correlation coefficient (R) of 0.031 and weighted average of 10.4%, a difference of 28.1%.
Unemployment Among Women with Children Ages 6 to 17 years Correlation Summary
| Measurement | Immigrants from Iraq | Immigrants from Cabo Verde |
| Minimum | 0.80% | 3.5% |
| Maximum | 38.4% | 19.1% |
| Range | 37.6% | 15.6% |
| Mean | 10.1% | 10.4% |
| Median | 8.3% | 9.1% |
| Interquartile 25% (IQ1) | 5.7% | 6.6% |
| Interquartile 75% (IQ3) | 11.1% | 14.5% |
| Interquartile Range (IQR) | 5.4% | 7.9% |
| Standard Deviation (Sample) | 7.9% | 4.9% |
| Standard Deviation (Population) | 7.9% | 4.8% |
Similar Demographics by Unemployment Among Women with Children Ages 6 to 17 years
Demographics Similar to Immigrants from Iraq by Unemployment Among Women with Children Ages 6 to 17 years
In terms of unemployment among women with children ages 6 to 17 years, the demographic groups most similar to Immigrants from Iraq are Danish (8.1%, a difference of 0.060%), Immigrants from Armenia (8.2%, a difference of 0.29%), Immigrants from Sudan (8.1%, a difference of 0.30%), Immigrants from Japan (8.2%, a difference of 0.35%), and Immigrants from Bosnia and Herzegovina (8.2%, a difference of 0.36%).
| Demographics | Rating | Rank | Unemployment Among Women with Children Ages 6 to 17 years |
| Immigrants | Bulgaria | 100.0 /100 | #45 | Exceptional 8.1% |
| Icelanders | 100.0 /100 | #46 | Exceptional 8.1% |
| Immigrants | Switzerland | 100.0 /100 | #47 | Exceptional 8.1% |
| Immigrants | Asia | 100.0 /100 | #48 | Exceptional 8.1% |
| Immigrants | Oceania | 100.0 /100 | #49 | Exceptional 8.1% |
| Hawaiians | 100.0 /100 | #50 | Exceptional 8.1% |
| Immigrants | Sudan | 100.0 /100 | #51 | Exceptional 8.1% |
| Immigrants | Iraq | 100.0 /100 | #52 | Exceptional 8.1% |
| Danes | 100.0 /100 | #53 | Exceptional 8.1% |
| Immigrants | Armenia | 100.0 /100 | #54 | Exceptional 8.2% |
| Immigrants | Japan | 100.0 /100 | #55 | Exceptional 8.2% |
| Immigrants | Bosnia and Herzegovina | 100.0 /100 | #56 | Exceptional 8.2% |
| Immigrants | Laos | 100.0 /100 | #57 | Exceptional 8.2% |
| Immigrants | Malaysia | 100.0 /100 | #58 | Exceptional 8.2% |
| Immigrants | Philippines | 100.0 /100 | #59 | Exceptional 8.2% |
Demographics Similar to Immigrants from Cabo Verde by Unemployment Among Women with Children Ages 6 to 17 years
In terms of unemployment among women with children ages 6 to 17 years, the demographic groups most similar to Immigrants from Cabo Verde are Bahamian (10.4%, a difference of 0.030%), American (10.4%, a difference of 0.050%), African (10.4%, a difference of 0.23%), Immigrants from Dominica (10.5%, a difference of 0.78%), and Bermudan (10.5%, a difference of 0.89%).
| Demographics | Rating | Rank | Unemployment Among Women with Children Ages 6 to 17 years |
| Immigrants | Senegal | 0.0 /100 | #307 | Tragic 10.2% |
| Dutch West Indians | 0.0 /100 | #308 | Tragic 10.2% |
| French Canadians | 0.0 /100 | #309 | Tragic 10.3% |
| Alaska Natives | 0.0 /100 | #310 | Tragic 10.3% |
| Immigrants | Liberia | 0.0 /100 | #311 | Tragic 10.3% |
| Africans | 0.0 /100 | #312 | Tragic 10.4% |
| Americans | 0.0 /100 | #313 | Tragic 10.4% |
| Immigrants | Cabo Verde | 0.0 /100 | #314 | Tragic 10.4% |
| Bahamians | 0.0 /100 | #315 | Tragic 10.4% |
| Immigrants | Dominica | 0.0 /100 | #316 | Tragic 10.5% |
| Bermudans | 0.0 /100 | #317 | Tragic 10.5% |
| Delaware | 0.0 /100 | #318 | Tragic 10.5% |
| Immigrants | Uganda | 0.0 /100 | #319 | Tragic 10.7% |
| Apache | 0.0 /100 | #320 | Tragic 10.7% |
| Tohono O'odham | 0.0 /100 | #321 | Tragic 10.7% |