Immigrants from Indonesia vs Immigrants from Turkey Median Family Income
COMPARE
Immigrants from Indonesia
Immigrants from Turkey
Median Family Income
Median Family Income Comparison
Immigrants from Indonesia
Immigrants from Turkey
$115,162
MEDIAN FAMILY INCOME
99.8/ 100
METRIC RATING
58th/ 347
METRIC RANK
$118,325
MEDIAN FAMILY INCOME
100.0/ 100
METRIC RATING
38th/ 347
METRIC RANK
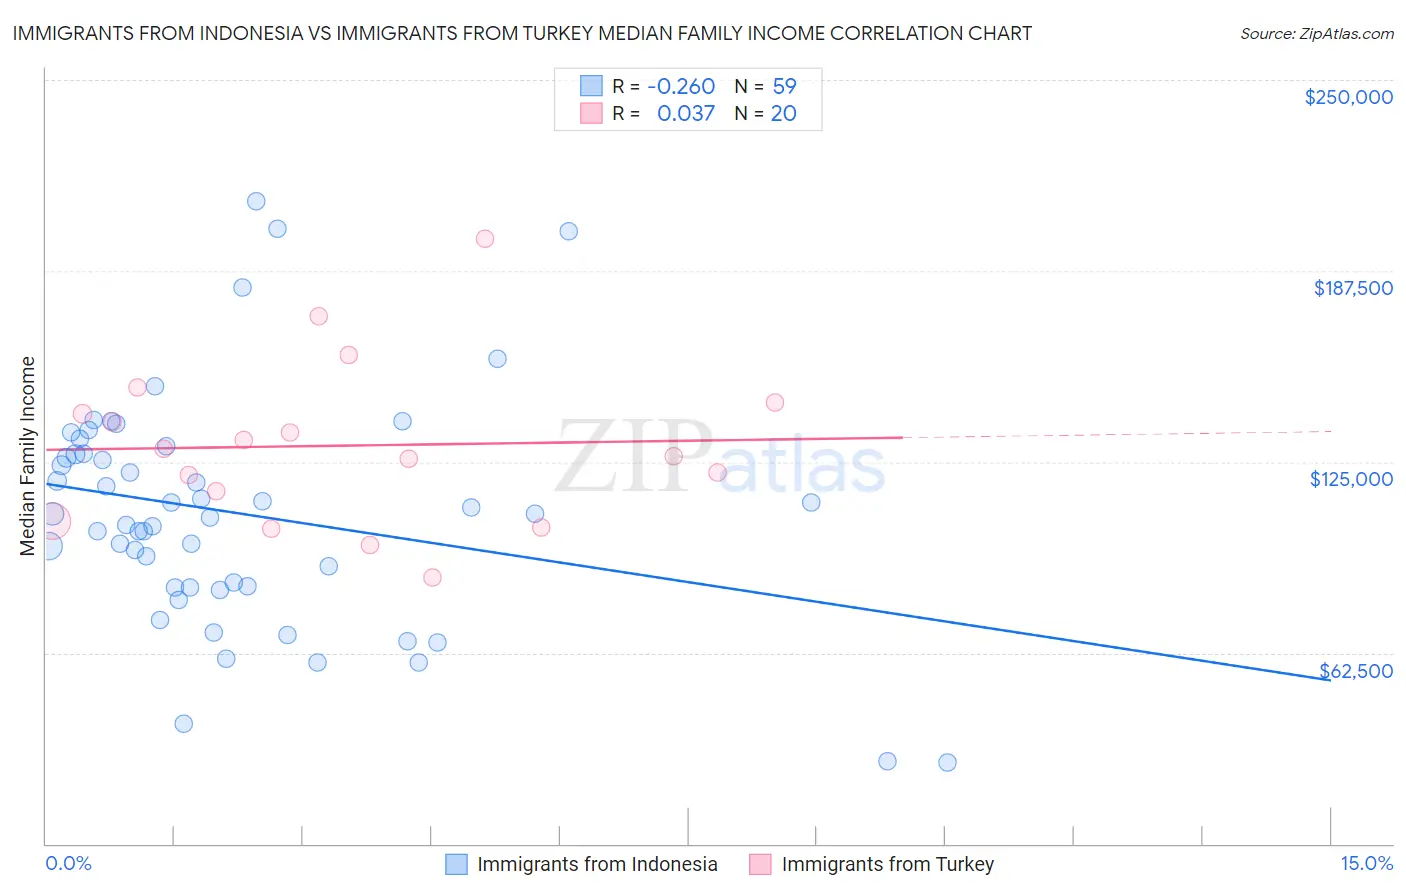
Immigrants from Indonesia vs Immigrants from Turkey Median Family Income Correlation Chart
The statistical analysis conducted on geographies consisting of 215,683,063 people shows a weak negative correlation between the proportion of Immigrants from Indonesia and median family income in the United States with a correlation coefficient (R) of -0.260 and weighted average of $115,162. Similarly, the statistical analysis conducted on geographies consisting of 222,914,261 people shows no correlation between the proportion of Immigrants from Turkey and median family income in the United States with a correlation coefficient (R) of 0.037 and weighted average of $118,325, a difference of 2.8%.
Median Family Income Correlation Summary
| Measurement | Immigrants from Indonesia | Immigrants from Turkey |
| Minimum | $26,694 | $87,281 |
| Maximum | $210,375 | $197,922 |
| Range | $183,681 | $110,641 |
| Mean | $108,164 | $130,330 |
| Median | $108,113 | $128,029 |
| Interquartile 25% (IQ1) | $84,077 | $110,406 |
| Interquartile 75% (IQ3) | $127,666 | $142,421 |
| Interquartile Range (IQR) | $43,589 | $32,015 |
| Standard Deviation (Sample) | $37,920 | $26,517 |
| Standard Deviation (Population) | $37,598 | $25,846 |
Demographics Similar to Immigrants from Indonesia and Immigrants from Turkey by Median Family Income
In terms of median family income, the demographic groups most similar to Immigrants from Indonesia are Greek ($115,192, a difference of 0.030%), New Zealander ($115,230, a difference of 0.060%), Lithuanian ($115,395, a difference of 0.20%), Immigrants from Europe ($115,523, a difference of 0.31%), and Immigrants from Norway ($115,847, a difference of 0.60%). Similarly, the demographic groups most similar to Immigrants from Turkey are Immigrants from Asia ($118,291, a difference of 0.030%), Immigrants from Lithuania ($118,053, a difference of 0.23%), Estonian ($118,013, a difference of 0.26%), Immigrants from Bolivia ($117,912, a difference of 0.35%), and Bulgarian ($117,818, a difference of 0.43%).
| Demographics | Rating | Rank | Median Family Income |
| Immigrants | Turkey | 100.0 /100 | #38 | Exceptional $118,325 |
| Immigrants | Asia | 100.0 /100 | #39 | Exceptional $118,291 |
| Immigrants | Lithuania | 100.0 /100 | #40 | Exceptional $118,053 |
| Estonians | 100.0 /100 | #41 | Exceptional $118,013 |
| Immigrants | Bolivia | 100.0 /100 | #42 | Exceptional $117,912 |
| Bulgarians | 100.0 /100 | #43 | Exceptional $117,818 |
| Cambodians | 100.0 /100 | #44 | Exceptional $117,780 |
| Immigrants | Greece | 99.9 /100 | #45 | Exceptional $117,344 |
| Immigrants | Russia | 99.9 /100 | #46 | Exceptional $116,942 |
| Immigrants | Austria | 99.9 /100 | #47 | Exceptional $116,830 |
| Immigrants | South Africa | 99.9 /100 | #48 | Exceptional $116,286 |
| Chinese | 99.9 /100 | #49 | Exceptional $116,188 |
| Immigrants | Czechoslovakia | 99.9 /100 | #50 | Exceptional $116,165 |
| Immigrants | Malaysia | 99.9 /100 | #51 | Exceptional $115,880 |
| Maltese | 99.9 /100 | #52 | Exceptional $115,862 |
| Immigrants | Norway | 99.9 /100 | #53 | Exceptional $115,847 |
| Immigrants | Europe | 99.9 /100 | #54 | Exceptional $115,523 |
| Lithuanians | 99.8 /100 | #55 | Exceptional $115,395 |
| New Zealanders | 99.8 /100 | #56 | Exceptional $115,230 |
| Greeks | 99.8 /100 | #57 | Exceptional $115,192 |
| Immigrants | Indonesia | 99.8 /100 | #58 | Exceptional $115,162 |