Immigrants from Indonesia vs Panamanian Cognitive Disability
COMPARE
Immigrants from Indonesia
Panamanian
Cognitive Disability
Cognitive Disability Comparison
Immigrants from Indonesia
Panamanians
17.1%
COGNITIVE DISABILITY
82.7/ 100
METRIC RATING
152nd/ 347
METRIC RANK
17.8%
COGNITIVE DISABILITY
2.1/ 100
METRIC RATING
233rd/ 347
METRIC RANK
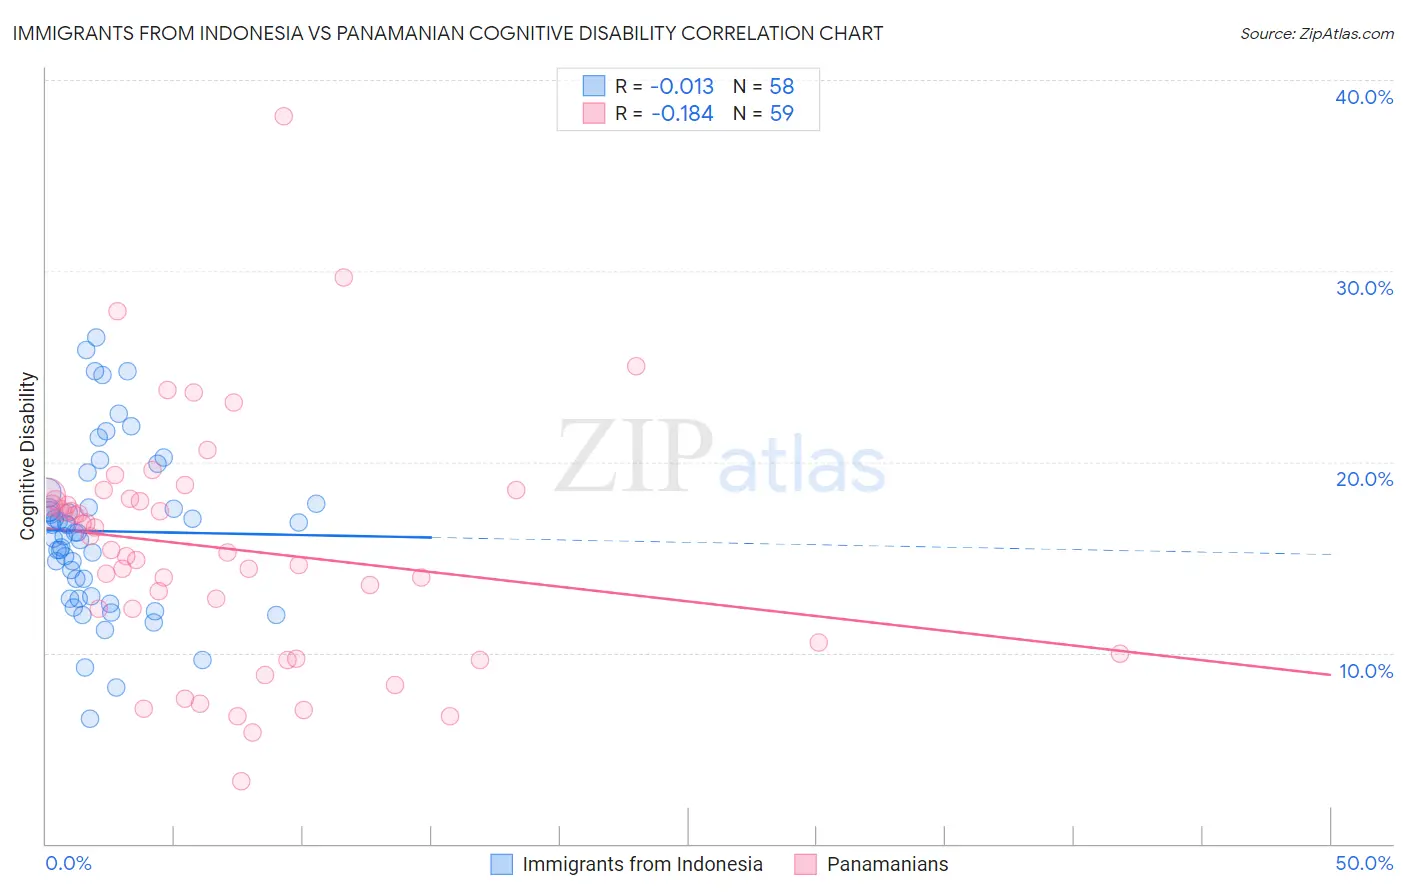
Immigrants from Indonesia vs Panamanian Cognitive Disability Correlation Chart
The statistical analysis conducted on geographies consisting of 215,789,545 people shows no correlation between the proportion of Immigrants from Indonesia and percentage of population with cognitive disability in the United States with a correlation coefficient (R) of -0.013 and weighted average of 17.1%. Similarly, the statistical analysis conducted on geographies consisting of 281,192,320 people shows a poor negative correlation between the proportion of Panamanians and percentage of population with cognitive disability in the United States with a correlation coefficient (R) of -0.184 and weighted average of 17.8%, a difference of 3.9%.
Cognitive Disability Correlation Summary
| Measurement | Immigrants from Indonesia | Panamanian |
| Minimum | 6.5% | 3.3% |
| Maximum | 26.5% | 38.1% |
| Range | 20.0% | 34.8% |
| Mean | 16.4% | 15.5% |
| Median | 16.3% | 15.4% |
| Interquartile 25% (IQ1) | 12.9% | 10.5% |
| Interquartile 75% (IQ3) | 17.8% | 18.1% |
| Interquartile Range (IQR) | 4.9% | 7.5% |
| Standard Deviation (Sample) | 4.3% | 6.3% |
| Standard Deviation (Population) | 4.3% | 6.2% |
Similar Demographics by Cognitive Disability
Demographics Similar to Immigrants from Indonesia by Cognitive Disability
In terms of cognitive disability, the demographic groups most similar to Immigrants from Indonesia are Syrian (17.1%, a difference of 0.020%), Immigrants from Kazakhstan (17.1%, a difference of 0.10%), Basque (17.1%, a difference of 0.15%), French Canadian (17.1%, a difference of 0.16%), and Cypriot (17.1%, a difference of 0.16%).
| Demographics | Rating | Rank | Cognitive Disability |
| Immigrants | South Eastern Asia | 88.7 /100 | #145 | Excellent 17.0% |
| Costa Ricans | 88.0 /100 | #146 | Excellent 17.0% |
| Scotch-Irish | 85.9 /100 | #147 | Excellent 17.1% |
| French Canadians | 85.7 /100 | #148 | Excellent 17.1% |
| Cypriots | 85.7 /100 | #149 | Excellent 17.1% |
| Basques | 85.5 /100 | #150 | Excellent 17.1% |
| Syrians | 83.0 /100 | #151 | Excellent 17.1% |
| Immigrants | Indonesia | 82.7 /100 | #152 | Excellent 17.1% |
| Immigrants | Kazakhstan | 80.5 /100 | #153 | Excellent 17.1% |
| Immigrants | Malaysia | 79.3 /100 | #154 | Good 17.1% |
| Brazilians | 78.9 /100 | #155 | Good 17.1% |
| Sri Lankans | 78.9 /100 | #156 | Good 17.1% |
| Immigrants | Australia | 76.0 /100 | #157 | Good 17.1% |
| Celtics | 74.1 /100 | #158 | Good 17.1% |
| Immigrants | Latvia | 73.2 /100 | #159 | Good 17.2% |
Demographics Similar to Panamanians by Cognitive Disability
In terms of cognitive disability, the demographic groups most similar to Panamanians are Guatemalan (17.8%, a difference of 0.0%), Tongan (17.8%, a difference of 0.0%), Osage (17.8%, a difference of 0.020%), Spanish American Indian (17.8%, a difference of 0.020%), and Mongolian (17.7%, a difference of 0.040%).
| Demographics | Rating | Rank | Cognitive Disability |
| Marshallese | 2.7 /100 | #226 | Tragic 17.7% |
| Immigrants | St. Vincent and the Grenadines | 2.6 /100 | #227 | Tragic 17.7% |
| Immigrants | Central America | 2.3 /100 | #228 | Tragic 17.7% |
| Immigrants | Guatemala | 2.2 /100 | #229 | Tragic 17.7% |
| Mongolians | 2.2 /100 | #230 | Tragic 17.7% |
| Guatemalans | 2.1 /100 | #231 | Tragic 17.8% |
| Tongans | 2.1 /100 | #232 | Tragic 17.8% |
| Panamanians | 2.1 /100 | #233 | Tragic 17.8% |
| Osage | 2.0 /100 | #234 | Tragic 17.8% |
| Spanish American Indians | 2.0 /100 | #235 | Tragic 17.8% |
| Immigrants | Iraq | 1.8 /100 | #236 | Tragic 17.8% |
| Immigrants | Mexico | 1.8 /100 | #237 | Tragic 17.8% |
| Cheyenne | 1.7 /100 | #238 | Tragic 17.8% |
| Cajuns | 1.4 /100 | #239 | Tragic 17.8% |
| Iraqis | 1.4 /100 | #240 | Tragic 17.8% |