Immigrants from Indonesia vs Yaqui Cognitive Disability
COMPARE
Immigrants from Indonesia
Yaqui
Cognitive Disability
Cognitive Disability Comparison
Immigrants from Indonesia
Yaqui
17.1%
COGNITIVE DISABILITY
82.7/ 100
METRIC RATING
152nd/ 347
METRIC RANK
18.5%
COGNITIVE DISABILITY
0.0/ 100
METRIC RATING
313th/ 347
METRIC RANK
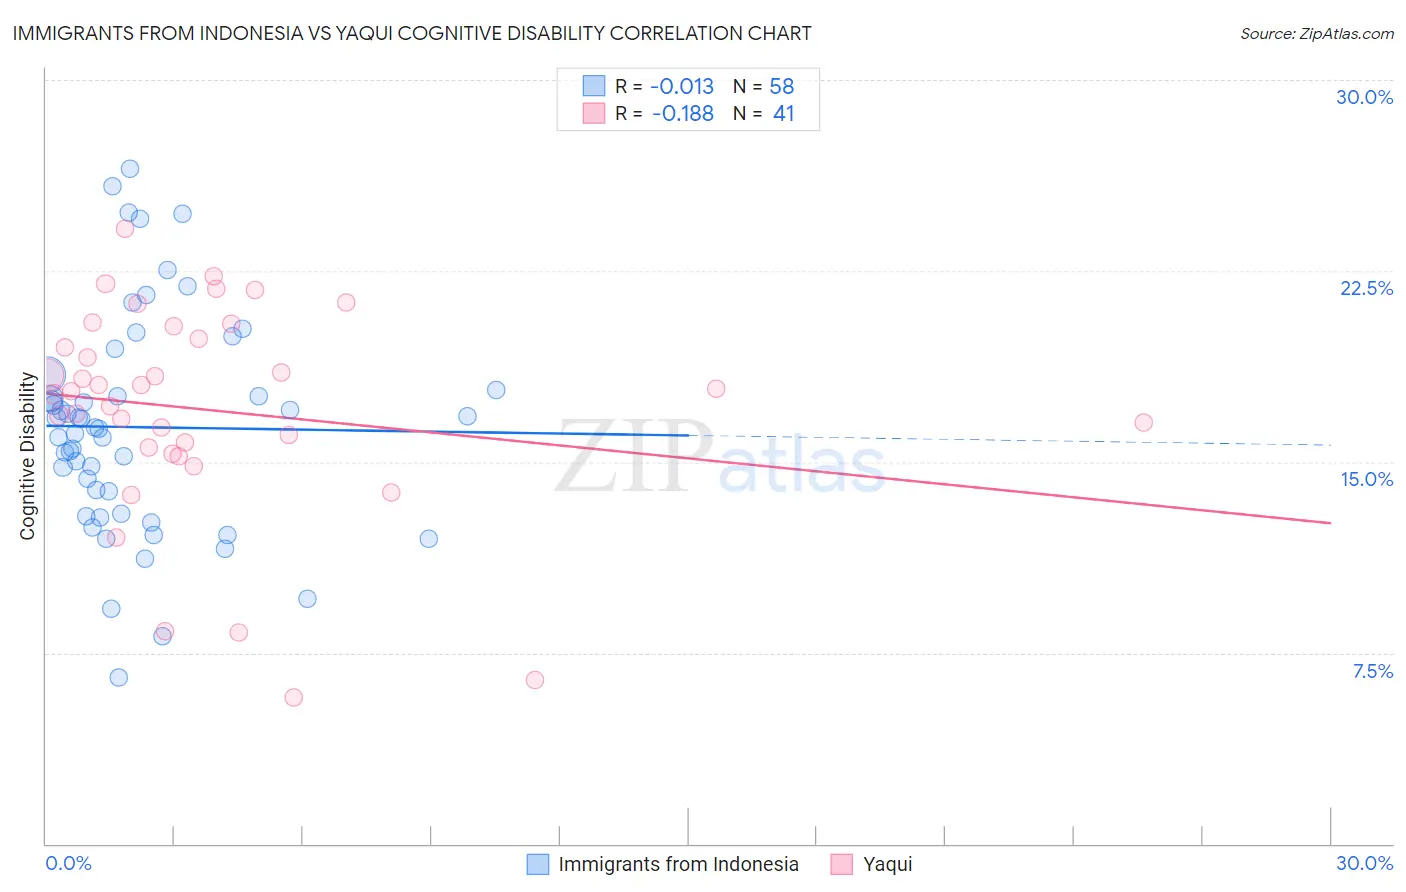
Immigrants from Indonesia vs Yaqui Cognitive Disability Correlation Chart
The statistical analysis conducted on geographies consisting of 215,789,545 people shows no correlation between the proportion of Immigrants from Indonesia and percentage of population with cognitive disability in the United States with a correlation coefficient (R) of -0.013 and weighted average of 17.1%. Similarly, the statistical analysis conducted on geographies consisting of 107,721,250 people shows a poor negative correlation between the proportion of Yaqui and percentage of population with cognitive disability in the United States with a correlation coefficient (R) of -0.188 and weighted average of 18.5%, a difference of 8.4%.
Cognitive Disability Correlation Summary
| Measurement | Immigrants from Indonesia | Yaqui |
| Minimum | 6.5% | 5.8% |
| Maximum | 26.5% | 24.2% |
| Range | 20.0% | 18.4% |
| Mean | 16.4% | 17.0% |
| Median | 16.3% | 17.8% |
| Interquartile 25% (IQ1) | 12.9% | 15.4% |
| Interquartile 75% (IQ3) | 17.8% | 20.1% |
| Interquartile Range (IQR) | 4.9% | 4.7% |
| Standard Deviation (Sample) | 4.3% | 4.2% |
| Standard Deviation (Population) | 4.3% | 4.1% |
Similar Demographics by Cognitive Disability
Demographics Similar to Immigrants from Indonesia by Cognitive Disability
In terms of cognitive disability, the demographic groups most similar to Immigrants from Indonesia are Syrian (17.1%, a difference of 0.020%), Immigrants from Kazakhstan (17.1%, a difference of 0.10%), Basque (17.1%, a difference of 0.15%), French Canadian (17.1%, a difference of 0.16%), and Cypriot (17.1%, a difference of 0.16%).
| Demographics | Rating | Rank | Cognitive Disability |
| Immigrants | South Eastern Asia | 88.7 /100 | #145 | Excellent 17.0% |
| Costa Ricans | 88.0 /100 | #146 | Excellent 17.0% |
| Scotch-Irish | 85.9 /100 | #147 | Excellent 17.1% |
| French Canadians | 85.7 /100 | #148 | Excellent 17.1% |
| Cypriots | 85.7 /100 | #149 | Excellent 17.1% |
| Basques | 85.5 /100 | #150 | Excellent 17.1% |
| Syrians | 83.0 /100 | #151 | Excellent 17.1% |
| Immigrants | Indonesia | 82.7 /100 | #152 | Excellent 17.1% |
| Immigrants | Kazakhstan | 80.5 /100 | #153 | Excellent 17.1% |
| Immigrants | Malaysia | 79.3 /100 | #154 | Good 17.1% |
| Brazilians | 78.9 /100 | #155 | Good 17.1% |
| Sri Lankans | 78.9 /100 | #156 | Good 17.1% |
| Immigrants | Australia | 76.0 /100 | #157 | Good 17.1% |
| Celtics | 74.1 /100 | #158 | Good 17.1% |
| Immigrants | Latvia | 73.2 /100 | #159 | Good 17.2% |
Demographics Similar to Yaqui by Cognitive Disability
In terms of cognitive disability, the demographic groups most similar to Yaqui are Subsaharan African (18.5%, a difference of 0.060%), Chickasaw (18.5%, a difference of 0.11%), Immigrants from Dominica (18.6%, a difference of 0.24%), Immigrants from Middle Africa (18.6%, a difference of 0.32%), and Hmong (18.4%, a difference of 0.39%).
| Demographics | Rating | Rank | Cognitive Disability |
| Seminole | 0.0 /100 | #306 | Tragic 18.3% |
| Ugandans | 0.0 /100 | #307 | Tragic 18.3% |
| Immigrants | Western Africa | 0.0 /100 | #308 | Tragic 18.4% |
| Immigrants | Eastern Africa | 0.0 /100 | #309 | Tragic 18.4% |
| Choctaw | 0.0 /100 | #310 | Tragic 18.4% |
| Hmong | 0.0 /100 | #311 | Tragic 18.4% |
| Chickasaw | 0.0 /100 | #312 | Tragic 18.5% |
| Yaqui | 0.0 /100 | #313 | Tragic 18.5% |
| Sub-Saharan Africans | 0.0 /100 | #314 | Tragic 18.5% |
| Immigrants | Dominica | 0.0 /100 | #315 | Tragic 18.6% |
| Immigrants | Middle Africa | 0.0 /100 | #316 | Tragic 18.6% |
| Liberians | 0.0 /100 | #317 | Tragic 18.6% |
| Bangladeshis | 0.0 /100 | #318 | Tragic 18.6% |
| Comanche | 0.0 /100 | #319 | Tragic 18.6% |
| Apache | 0.0 /100 | #320 | Tragic 18.6% |