Immigrants from Indonesia vs Immigrants from Switzerland Cognitive Disability
COMPARE
Immigrants from Indonesia
Immigrants from Switzerland
Cognitive Disability
Cognitive Disability Comparison
Immigrants from Indonesia
Immigrants from Switzerland
17.1%
COGNITIVE DISABILITY
82.7/ 100
METRIC RATING
152nd/ 347
METRIC RANK
17.2%
COGNITIVE DISABILITY
71.5/ 100
METRIC RATING
163rd/ 347
METRIC RANK
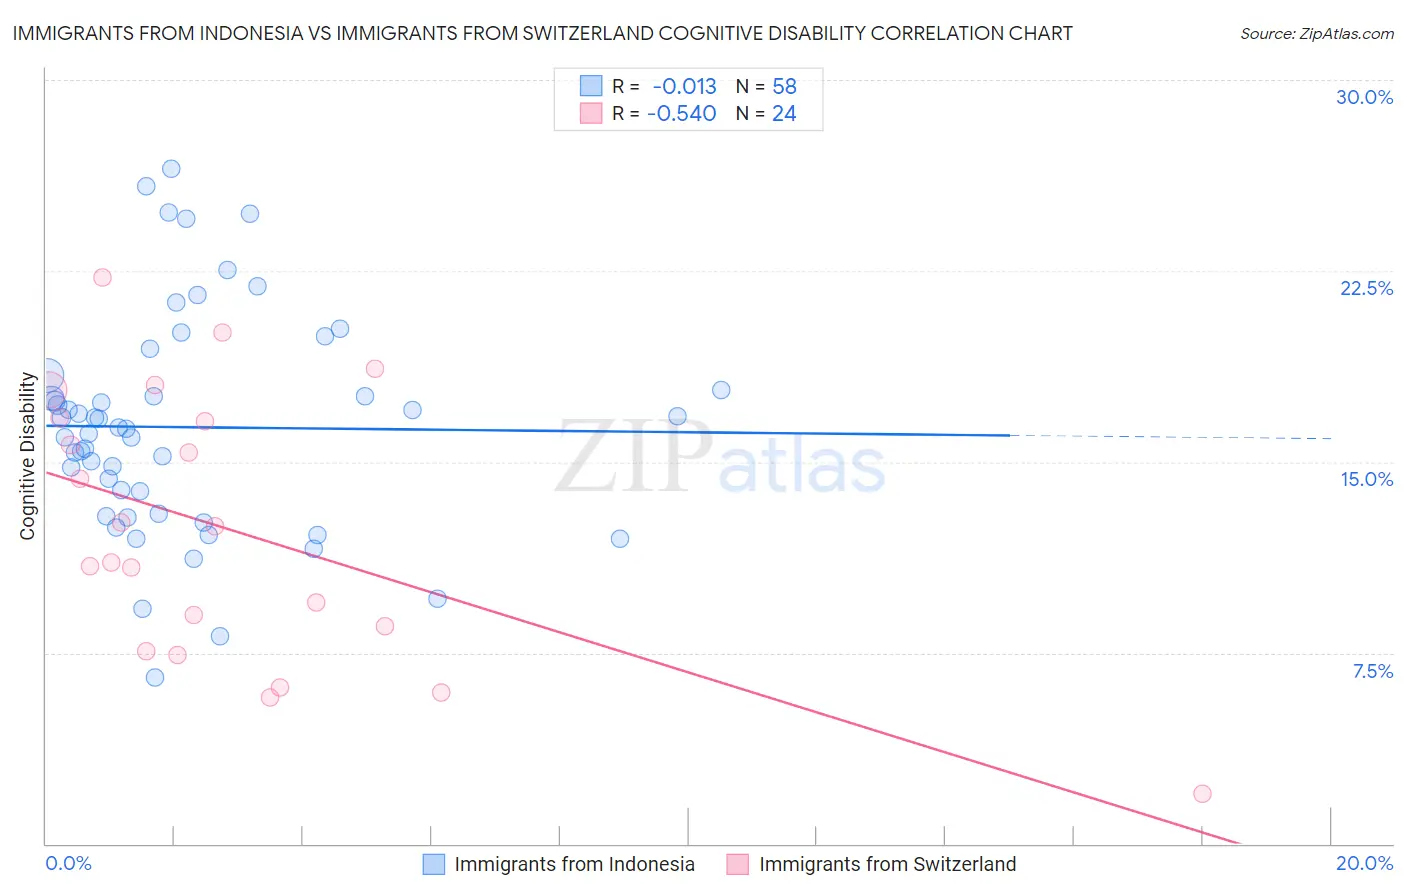
Immigrants from Indonesia vs Immigrants from Switzerland Cognitive Disability Correlation Chart
The statistical analysis conducted on geographies consisting of 215,789,545 people shows no correlation between the proportion of Immigrants from Indonesia and percentage of population with cognitive disability in the United States with a correlation coefficient (R) of -0.013 and weighted average of 17.1%. Similarly, the statistical analysis conducted on geographies consisting of 148,077,792 people shows a substantial negative correlation between the proportion of Immigrants from Switzerland and percentage of population with cognitive disability in the United States with a correlation coefficient (R) of -0.540 and weighted average of 17.2%, a difference of 0.46%.
Cognitive Disability Correlation Summary
| Measurement | Immigrants from Indonesia | Immigrants from Switzerland |
| Minimum | 6.5% | 2.0% |
| Maximum | 26.5% | 22.2% |
| Range | 20.0% | 20.3% |
| Mean | 16.4% | 12.3% |
| Median | 16.3% | 11.8% |
| Interquartile 25% (IQ1) | 12.9% | 8.0% |
| Interquartile 75% (IQ3) | 17.8% | 16.7% |
| Interquartile Range (IQR) | 4.9% | 8.6% |
| Standard Deviation (Sample) | 4.3% | 5.3% |
| Standard Deviation (Population) | 4.3% | 5.2% |
Demographics Similar to Immigrants from Indonesia and Immigrants from Switzerland by Cognitive Disability
In terms of cognitive disability, the demographic groups most similar to Immigrants from Indonesia are Syrian (17.1%, a difference of 0.020%), Immigrants from Kazakhstan (17.1%, a difference of 0.10%), Basque (17.1%, a difference of 0.15%), French Canadian (17.1%, a difference of 0.16%), and Cypriot (17.1%, a difference of 0.16%). Similarly, the demographic groups most similar to Immigrants from Switzerland are Yugoslavian (17.2%, a difference of 0.0%), American (17.2%, a difference of 0.020%), Australian (17.2%, a difference of 0.030%), Armenian (17.2%, a difference of 0.050%), and Immigrants from Latvia (17.2%, a difference of 0.060%).
| Demographics | Rating | Rank | Cognitive Disability |
| Scotch-Irish | 85.9 /100 | #147 | Excellent 17.1% |
| French Canadians | 85.7 /100 | #148 | Excellent 17.1% |
| Cypriots | 85.7 /100 | #149 | Excellent 17.1% |
| Basques | 85.5 /100 | #150 | Excellent 17.1% |
| Syrians | 83.0 /100 | #151 | Excellent 17.1% |
| Immigrants | Indonesia | 82.7 /100 | #152 | Excellent 17.1% |
| Immigrants | Kazakhstan | 80.5 /100 | #153 | Excellent 17.1% |
| Immigrants | Malaysia | 79.3 /100 | #154 | Good 17.1% |
| Brazilians | 78.9 /100 | #155 | Good 17.1% |
| Sri Lankans | 78.9 /100 | #156 | Good 17.1% |
| Immigrants | Australia | 76.0 /100 | #157 | Good 17.1% |
| Celtics | 74.1 /100 | #158 | Good 17.1% |
| Immigrants | Latvia | 73.2 /100 | #159 | Good 17.2% |
| Australians | 72.4 /100 | #160 | Good 17.2% |
| Americans | 72.2 /100 | #161 | Good 17.2% |
| Yugoslavians | 71.6 /100 | #162 | Good 17.2% |
| Immigrants | Switzerland | 71.5 /100 | #163 | Good 17.2% |
| Armenians | 70.1 /100 | #164 | Good 17.2% |
| Immigrants | Albania | 64.9 /100 | #165 | Good 17.2% |
| Immigrants | Ecuador | 64.4 /100 | #166 | Good 17.2% |
| Immigrants | Syria | 63.5 /100 | #167 | Good 17.2% |