Immigrants from India vs Immigrants from Nepal Disability Age 5 to 17
COMPARE
Immigrants from India
Immigrants from Nepal
Disability Age 5 to 17
Disability Age 5 to 17 Comparison
Immigrants from India
Immigrants from Nepal
4.6%
DISABILITY AGE 5 TO 17
100.0/ 100
METRIC RATING
10th/ 347
METRIC RANK
5.5%
DISABILITY AGE 5 TO 17
77.1/ 100
METRIC RATING
158th/ 347
METRIC RANK
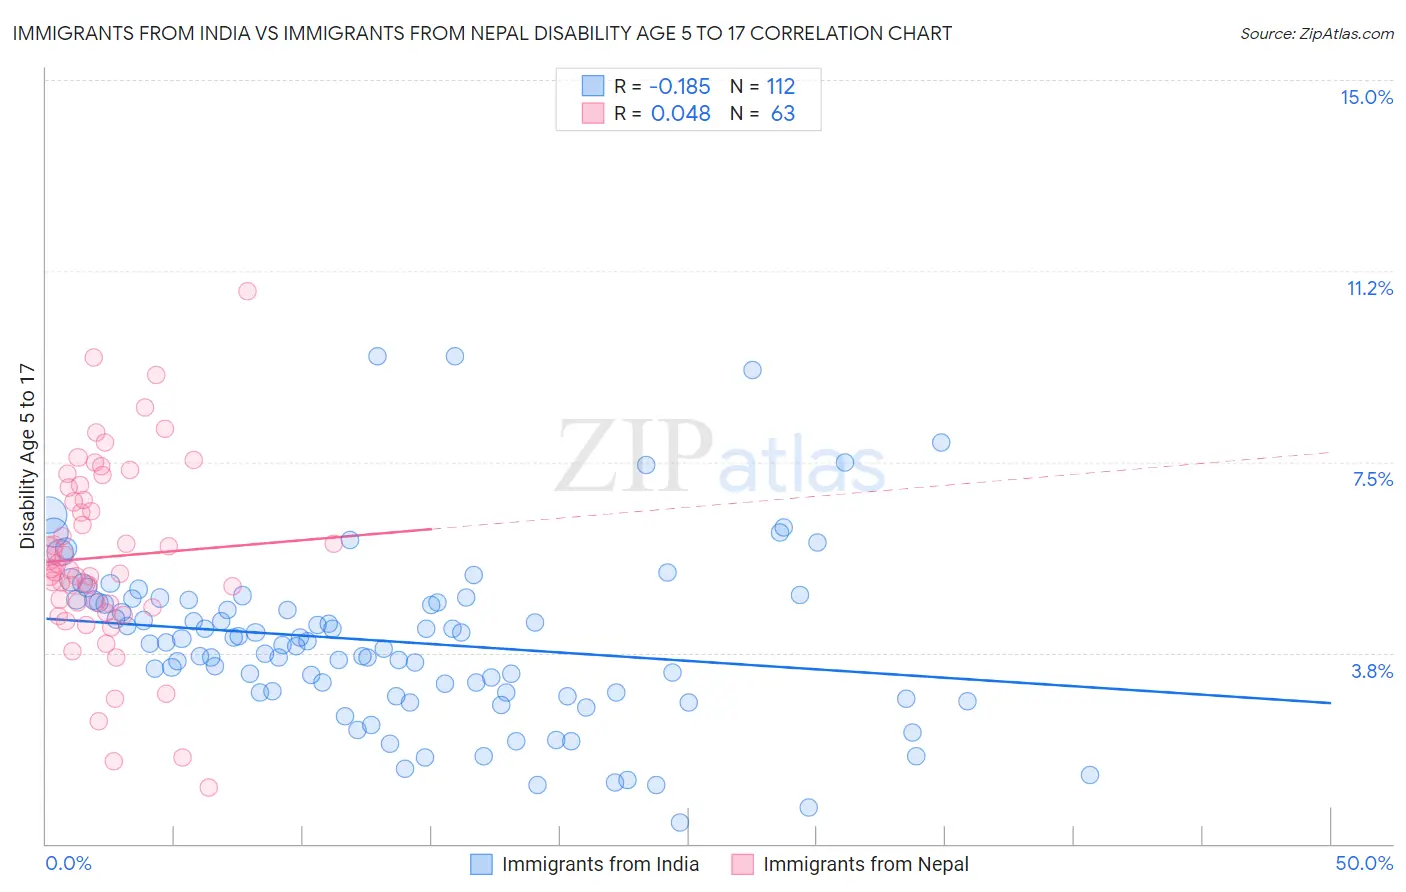
Immigrants from India vs Immigrants from Nepal Disability Age 5 to 17 Correlation Chart
The statistical analysis conducted on geographies consisting of 430,066,965 people shows a poor negative correlation between the proportion of Immigrants from India and percentage of population with a disability between the ages 5 and 17 in the United States with a correlation coefficient (R) of -0.185 and weighted average of 4.6%. Similarly, the statistical analysis conducted on geographies consisting of 186,213,470 people shows no correlation between the proportion of Immigrants from Nepal and percentage of population with a disability between the ages 5 and 17 in the United States with a correlation coefficient (R) of 0.048 and weighted average of 5.5%, a difference of 20.3%.
Disability Age 5 to 17 Correlation Summary
| Measurement | Immigrants from India | Immigrants from Nepal |
| Minimum | 0.42% | 1.1% |
| Maximum | 9.6% | 10.9% |
| Range | 9.1% | 9.7% |
| Mean | 4.0% | 5.6% |
| Median | 3.9% | 5.4% |
| Interquartile 25% (IQ1) | 3.0% | 4.6% |
| Interquartile 75% (IQ3) | 4.8% | 7.0% |
| Interquartile Range (IQR) | 1.8% | 2.4% |
| Standard Deviation (Sample) | 1.7% | 1.9% |
| Standard Deviation (Population) | 1.7% | 1.9% |
Similar Demographics by Disability Age 5 to 17
Demographics Similar to Immigrants from India by Disability Age 5 to 17
In terms of disability age 5 to 17, the demographic groups most similar to Immigrants from India are Immigrants from Eastern Asia (4.6%, a difference of 0.070%), Armenian (4.6%, a difference of 0.16%), Indian (Asian) (4.6%, a difference of 0.40%), Iranian (4.6%, a difference of 0.40%), and Immigrants from China (4.5%, a difference of 1.3%).
| Demographics | Rating | Rank | Disability Age 5 to 17 |
| Immigrants | Hong Kong | 100.0 /100 | #3 | Exceptional 4.3% |
| Filipinos | 100.0 /100 | #4 | Exceptional 4.3% |
| Immigrants | Iran | 100.0 /100 | #5 | Exceptional 4.4% |
| Immigrants | Israel | 100.0 /100 | #6 | Exceptional 4.5% |
| Immigrants | China | 100.0 /100 | #7 | Exceptional 4.5% |
| Indians (Asian) | 100.0 /100 | #8 | Exceptional 4.6% |
| Immigrants | Eastern Asia | 100.0 /100 | #9 | Exceptional 4.6% |
| Immigrants | India | 100.0 /100 | #10 | Exceptional 4.6% |
| Armenians | 100.0 /100 | #11 | Exceptional 4.6% |
| Iranians | 100.0 /100 | #12 | Exceptional 4.6% |
| Thais | 100.0 /100 | #13 | Exceptional 4.7% |
| Immigrants | Korea | 100.0 /100 | #14 | Exceptional 4.7% |
| Chinese | 100.0 /100 | #15 | Exceptional 4.7% |
| Immigrants | Singapore | 100.0 /100 | #16 | Exceptional 4.7% |
| Arapaho | 100.0 /100 | #17 | Exceptional 4.7% |
Demographics Similar to Immigrants from Nepal by Disability Age 5 to 17
In terms of disability age 5 to 17, the demographic groups most similar to Immigrants from Nepal are Immigrants from Costa Rica (5.5%, a difference of 0.050%), Hawaiian (5.5%, a difference of 0.060%), Immigrants from Ecuador (5.5%, a difference of 0.080%), Australian (5.5%, a difference of 0.12%), and Immigrants from Zimbabwe (5.5%, a difference of 0.13%).
| Demographics | Rating | Rank | Disability Age 5 to 17 |
| Estonians | 80.8 /100 | #151 | Excellent 5.5% |
| Ute | 80.6 /100 | #152 | Excellent 5.5% |
| Ecuadorians | 79.7 /100 | #153 | Good 5.5% |
| Australians | 78.8 /100 | #154 | Good 5.5% |
| Immigrants | Ecuador | 78.3 /100 | #155 | Good 5.5% |
| Hawaiians | 78.0 /100 | #156 | Good 5.5% |
| Immigrants | Costa Rica | 77.9 /100 | #157 | Good 5.5% |
| Immigrants | Nepal | 77.1 /100 | #158 | Good 5.5% |
| Immigrants | Zimbabwe | 75.3 /100 | #159 | Good 5.5% |
| South Africans | 73.3 /100 | #160 | Good 5.5% |
| Immigrants | Saudi Arabia | 69.1 /100 | #161 | Good 5.5% |
| Zimbabweans | 67.2 /100 | #162 | Good 5.5% |
| Immigrants | Southern Europe | 64.0 /100 | #163 | Good 5.6% |
| Immigrants | Scotland | 61.9 /100 | #164 | Good 5.6% |
| Lebanese | 61.4 /100 | #165 | Good 5.6% |