Immigrants from Hungary vs South African Ambulatory Disability
COMPARE
Immigrants from Hungary
South African
Ambulatory Disability
Ambulatory Disability Comparison
Immigrants from Hungary
South Africans
6.0%
AMBULATORY DISABILITY
83.9/ 100
METRIC RATING
138th/ 347
METRIC RANK
5.9%
AMBULATORY DISABILITY
96.3/ 100
METRIC RATING
112th/ 347
METRIC RANK
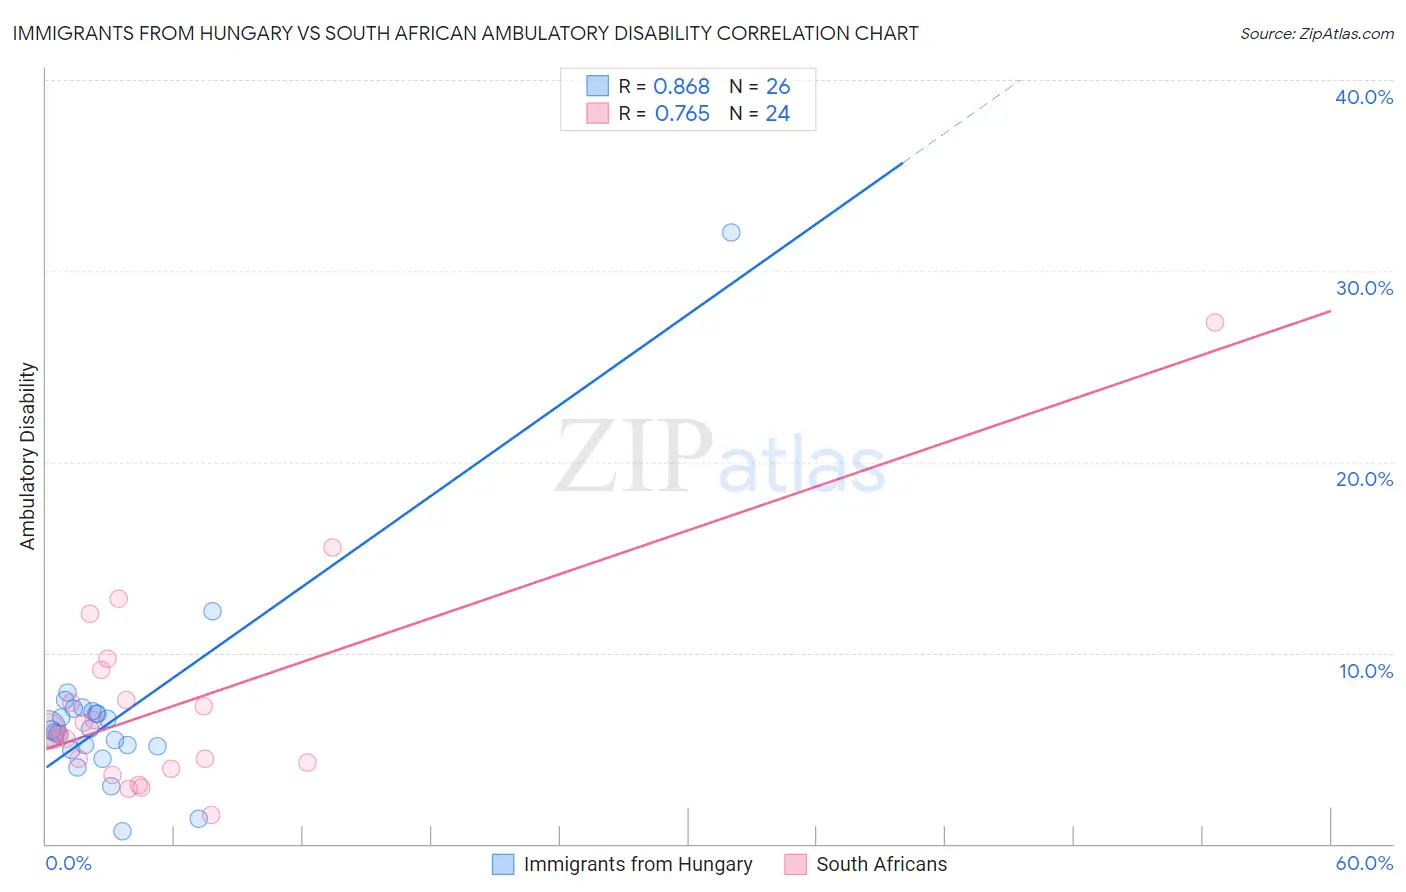
Immigrants from Hungary vs South African Ambulatory Disability Correlation Chart
The statistical analysis conducted on geographies consisting of 195,671,605 people shows a very strong positive correlation between the proportion of Immigrants from Hungary and percentage of population with ambulatory disability in the United States with a correlation coefficient (R) of 0.868 and weighted average of 6.0%. Similarly, the statistical analysis conducted on geographies consisting of 182,561,768 people shows a strong positive correlation between the proportion of South Africans and percentage of population with ambulatory disability in the United States with a correlation coefficient (R) of 0.765 and weighted average of 5.9%, a difference of 2.2%.
Ambulatory Disability Correlation Summary
| Measurement | Immigrants from Hungary | South African |
| Minimum | 0.66% | 1.5% |
| Maximum | 32.0% | 27.3% |
| Range | 31.3% | 25.7% |
| Mean | 6.8% | 7.3% |
| Median | 6.0% | 5.8% |
| Interquartile 25% (IQ1) | 5.1% | 4.1% |
| Interquartile 75% (IQ3) | 7.0% | 8.3% |
| Interquartile Range (IQR) | 1.9% | 4.2% |
| Standard Deviation (Sample) | 5.6% | 5.4% |
| Standard Deviation (Population) | 5.5% | 5.3% |
Similar Demographics by Ambulatory Disability
Demographics Similar to Immigrants from Hungary by Ambulatory Disability
In terms of ambulatory disability, the demographic groups most similar to Immigrants from Hungary are Immigrants from North Macedonia (6.0%, a difference of 0.020%), Immigrants from Syria (6.0%, a difference of 0.020%), Immigrants from Zaire (6.0%, a difference of 0.030%), Czech (6.0%, a difference of 0.060%), and Swedish (6.0%, a difference of 0.080%).
| Demographics | Rating | Rank | Ambulatory Disability |
| Immigrants | Costa Rica | 89.5 /100 | #131 | Excellent 5.9% |
| Immigrants | Europe | 87.8 /100 | #132 | Excellent 6.0% |
| Immigrants | Immigrants | 86.9 /100 | #133 | Excellent 6.0% |
| Ute | 86.6 /100 | #134 | Excellent 6.0% |
| Immigrants | Italy | 85.0 /100 | #135 | Excellent 6.0% |
| Immigrants | North Macedonia | 84.1 /100 | #136 | Excellent 6.0% |
| Immigrants | Syria | 84.1 /100 | #137 | Excellent 6.0% |
| Immigrants | Hungary | 83.9 /100 | #138 | Excellent 6.0% |
| Immigrants | Zaire | 83.6 /100 | #139 | Excellent 6.0% |
| Czechs | 83.3 /100 | #140 | Excellent 6.0% |
| Swedes | 83.1 /100 | #141 | Excellent 6.0% |
| Immigrants | Philippines | 83.0 /100 | #142 | Excellent 6.0% |
| Romanians | 82.9 /100 | #143 | Excellent 6.0% |
| Macedonians | 82.8 /100 | #144 | Excellent 6.0% |
| Pakistanis | 82.5 /100 | #145 | Excellent 6.0% |
Demographics Similar to South Africans by Ambulatory Disability
In terms of ambulatory disability, the demographic groups most similar to South Africans are Danish (5.8%, a difference of 0.13%), Immigrants from Colombia (5.8%, a difference of 0.20%), Immigrants from Uruguay (5.9%, a difference of 0.22%), Immigrants from Poland (5.9%, a difference of 0.28%), and Immigrants from Netherlands (5.8%, a difference of 0.38%).
| Demographics | Rating | Rank | Ambulatory Disability |
| Immigrants | Czechoslovakia | 97.4 /100 | #105 | Exceptional 5.8% |
| Immigrants | Morocco | 97.3 /100 | #106 | Exceptional 5.8% |
| Uruguayans | 97.2 /100 | #107 | Exceptional 5.8% |
| Colombians | 97.2 /100 | #108 | Exceptional 5.8% |
| Immigrants | Netherlands | 97.1 /100 | #109 | Exceptional 5.8% |
| Immigrants | Colombia | 96.7 /100 | #110 | Exceptional 5.8% |
| Danes | 96.6 /100 | #111 | Exceptional 5.8% |
| South Africans | 96.3 /100 | #112 | Exceptional 5.9% |
| Immigrants | Uruguay | 95.6 /100 | #113 | Exceptional 5.9% |
| Immigrants | Poland | 95.4 /100 | #114 | Exceptional 5.9% |
| South American Indians | 94.8 /100 | #115 | Exceptional 5.9% |
| Immigrants | Africa | 94.7 /100 | #116 | Exceptional 5.9% |
| Immigrants | South Eastern Asia | 93.6 /100 | #117 | Exceptional 5.9% |
| Russians | 93.4 /100 | #118 | Exceptional 5.9% |
| Norwegians | 93.1 /100 | #119 | Exceptional 5.9% |