Native Hawaiian vs South African Ambulatory Disability
COMPARE
Native Hawaiian
South African
Ambulatory Disability
Ambulatory Disability Comparison
Native Hawaiians
South Africans
6.5%
AMBULATORY DISABILITY
1.1/ 100
METRIC RATING
249th/ 347
METRIC RANK
5.9%
AMBULATORY DISABILITY
96.3/ 100
METRIC RATING
112th/ 347
METRIC RANK
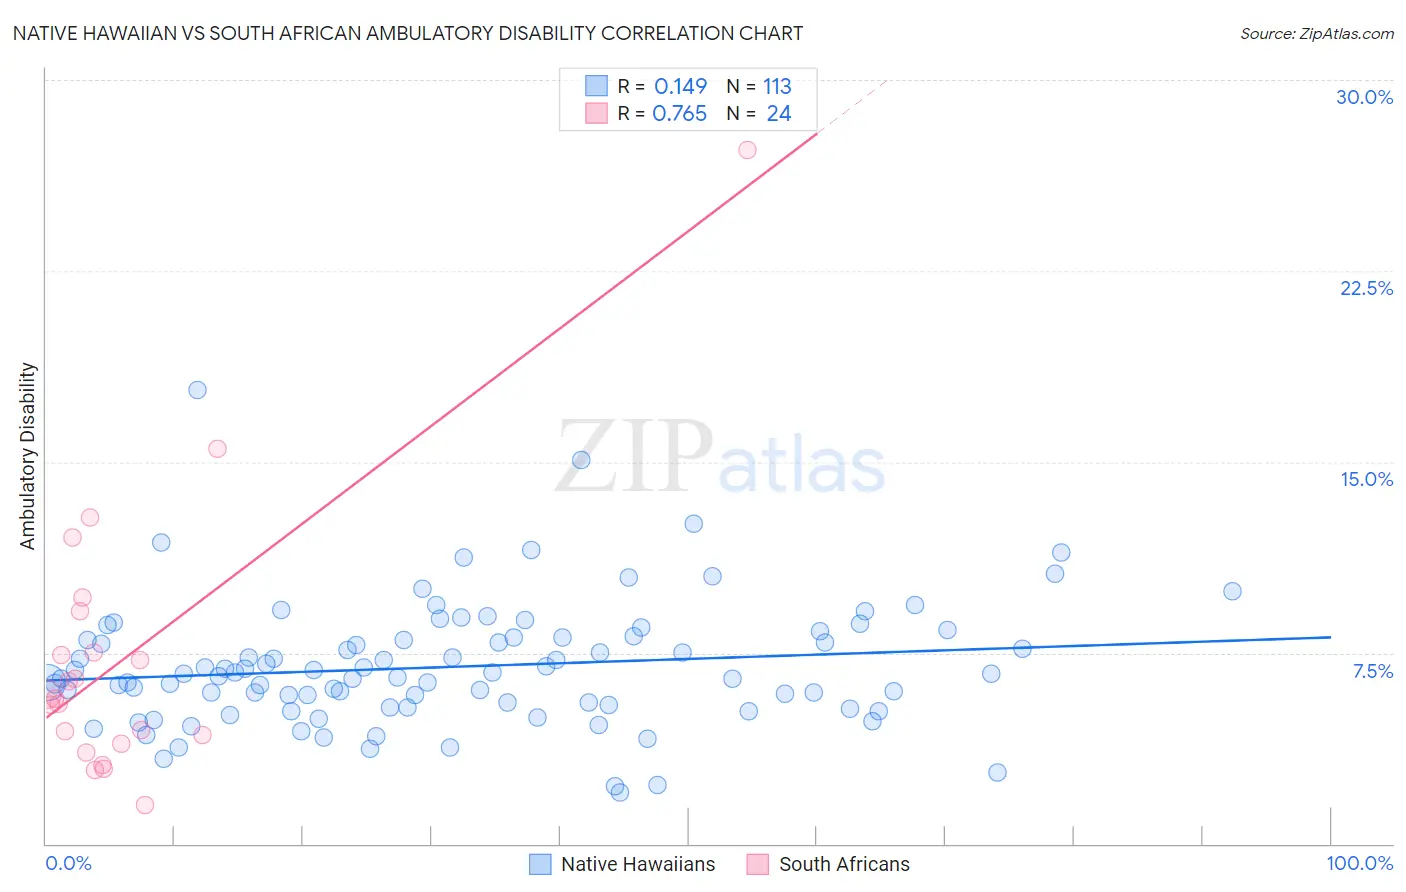
Native Hawaiian vs South African Ambulatory Disability Correlation Chart
The statistical analysis conducted on geographies consisting of 331,921,721 people shows a poor positive correlation between the proportion of Native Hawaiians and percentage of population with ambulatory disability in the United States with a correlation coefficient (R) of 0.149 and weighted average of 6.5%. Similarly, the statistical analysis conducted on geographies consisting of 182,561,768 people shows a strong positive correlation between the proportion of South Africans and percentage of population with ambulatory disability in the United States with a correlation coefficient (R) of 0.765 and weighted average of 5.9%, a difference of 10.7%.
Ambulatory Disability Correlation Summary
| Measurement | Native Hawaiian | South African |
| Minimum | 2.0% | 1.5% |
| Maximum | 17.8% | 27.3% |
| Range | 15.8% | 25.7% |
| Mean | 6.9% | 7.3% |
| Median | 6.7% | 5.8% |
| Interquartile 25% (IQ1) | 5.4% | 4.1% |
| Interquartile 75% (IQ3) | 8.1% | 8.3% |
| Interquartile Range (IQR) | 2.7% | 4.2% |
| Standard Deviation (Sample) | 2.4% | 5.4% |
| Standard Deviation (Population) | 2.4% | 5.3% |
Similar Demographics by Ambulatory Disability
Demographics Similar to Native Hawaiians by Ambulatory Disability
In terms of ambulatory disability, the demographic groups most similar to Native Hawaiians are Chinese (6.5%, a difference of 0.080%), Hawaiian (6.5%, a difference of 0.26%), Immigrants from Portugal (6.5%, a difference of 0.28%), Immigrants from Cuba (6.5%, a difference of 0.30%), and Armenian (6.5%, a difference of 0.36%).
| Demographics | Rating | Rank | Ambulatory Disability |
| Spaniards | 1.6 /100 | #242 | Tragic 6.5% |
| Germans | 1.5 /100 | #243 | Tragic 6.5% |
| Immigrants | Panama | 1.5 /100 | #244 | Tragic 6.5% |
| Tlingit-Haida | 1.5 /100 | #245 | Tragic 6.5% |
| Armenians | 1.5 /100 | #246 | Tragic 6.5% |
| Immigrants | Cuba | 1.4 /100 | #247 | Tragic 6.5% |
| Immigrants | Portugal | 1.4 /100 | #248 | Tragic 6.5% |
| Native Hawaiians | 1.1 /100 | #249 | Tragic 6.5% |
| Chinese | 1.0 /100 | #250 | Tragic 6.5% |
| Hawaiians | 0.9 /100 | #251 | Tragic 6.5% |
| Immigrants | Bahamas | 0.8 /100 | #252 | Tragic 6.5% |
| Scottish | 0.7 /100 | #253 | Tragic 6.5% |
| Belizeans | 0.7 /100 | #254 | Tragic 6.5% |
| Welsh | 0.6 /100 | #255 | Tragic 6.5% |
| Immigrants | Uzbekistan | 0.6 /100 | #256 | Tragic 6.5% |
Demographics Similar to South Africans by Ambulatory Disability
In terms of ambulatory disability, the demographic groups most similar to South Africans are Danish (5.8%, a difference of 0.13%), Immigrants from Colombia (5.8%, a difference of 0.20%), Immigrants from Uruguay (5.9%, a difference of 0.22%), Immigrants from Poland (5.9%, a difference of 0.28%), and Immigrants from Netherlands (5.8%, a difference of 0.38%).
| Demographics | Rating | Rank | Ambulatory Disability |
| Immigrants | Czechoslovakia | 97.4 /100 | #105 | Exceptional 5.8% |
| Immigrants | Morocco | 97.3 /100 | #106 | Exceptional 5.8% |
| Uruguayans | 97.2 /100 | #107 | Exceptional 5.8% |
| Colombians | 97.2 /100 | #108 | Exceptional 5.8% |
| Immigrants | Netherlands | 97.1 /100 | #109 | Exceptional 5.8% |
| Immigrants | Colombia | 96.7 /100 | #110 | Exceptional 5.8% |
| Danes | 96.6 /100 | #111 | Exceptional 5.8% |
| South Africans | 96.3 /100 | #112 | Exceptional 5.9% |
| Immigrants | Uruguay | 95.6 /100 | #113 | Exceptional 5.9% |
| Immigrants | Poland | 95.4 /100 | #114 | Exceptional 5.9% |
| South American Indians | 94.8 /100 | #115 | Exceptional 5.9% |
| Immigrants | Africa | 94.7 /100 | #116 | Exceptional 5.9% |
| Immigrants | South Eastern Asia | 93.6 /100 | #117 | Exceptional 5.9% |
| Russians | 93.4 /100 | #118 | Exceptional 5.9% |
| Norwegians | 93.1 /100 | #119 | Exceptional 5.9% |