Immigrants from Hungary vs German Ambulatory Disability
COMPARE
Immigrants from Hungary
German
Ambulatory Disability
Ambulatory Disability Comparison
Immigrants from Hungary
Germans
6.0%
AMBULATORY DISABILITY
83.9/ 100
METRIC RATING
138th/ 347
METRIC RANK
6.5%
AMBULATORY DISABILITY
1.5/ 100
METRIC RATING
243rd/ 347
METRIC RANK
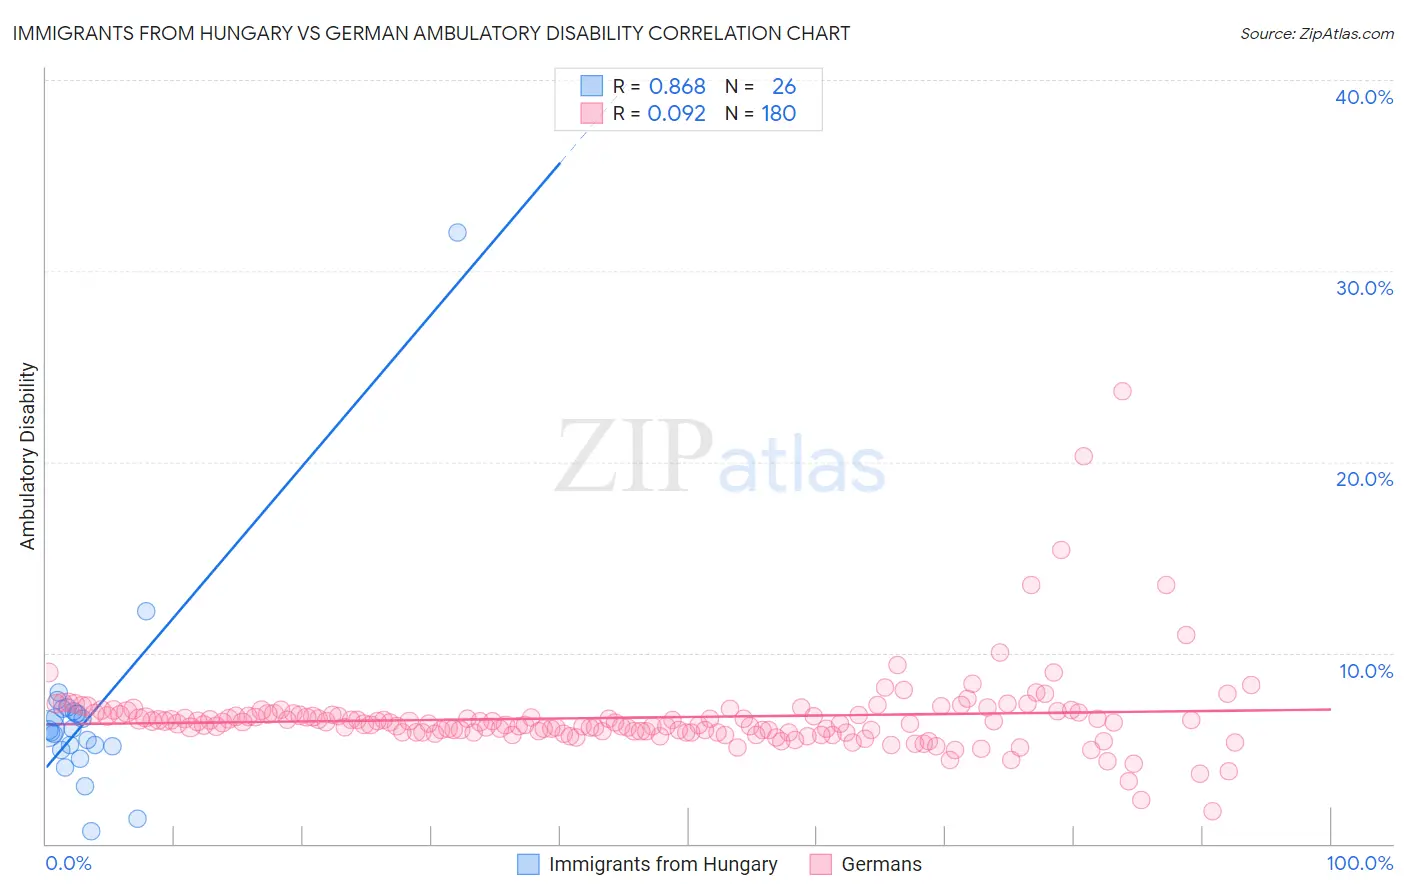
Immigrants from Hungary vs German Ambulatory Disability Correlation Chart
The statistical analysis conducted on geographies consisting of 195,671,605 people shows a very strong positive correlation between the proportion of Immigrants from Hungary and percentage of population with ambulatory disability in the United States with a correlation coefficient (R) of 0.868 and weighted average of 6.0%. Similarly, the statistical analysis conducted on geographies consisting of 580,433,029 people shows a slight positive correlation between the proportion of Germans and percentage of population with ambulatory disability in the United States with a correlation coefficient (R) of 0.092 and weighted average of 6.5%, a difference of 7.9%.
Ambulatory Disability Correlation Summary
| Measurement | Immigrants from Hungary | German |
| Minimum | 0.66% | 1.7% |
| Maximum | 32.0% | 23.7% |
| Range | 31.3% | 22.0% |
| Mean | 6.8% | 6.6% |
| Median | 6.0% | 6.3% |
| Interquartile 25% (IQ1) | 5.1% | 5.9% |
| Interquartile 75% (IQ3) | 7.0% | 6.8% |
| Interquartile Range (IQR) | 1.9% | 0.93% |
| Standard Deviation (Sample) | 5.6% | 2.2% |
| Standard Deviation (Population) | 5.5% | 2.2% |
Similar Demographics by Ambulatory Disability
Demographics Similar to Immigrants from Hungary by Ambulatory Disability
In terms of ambulatory disability, the demographic groups most similar to Immigrants from Hungary are Immigrants from North Macedonia (6.0%, a difference of 0.020%), Immigrants from Syria (6.0%, a difference of 0.020%), Immigrants from Zaire (6.0%, a difference of 0.030%), Czech (6.0%, a difference of 0.060%), and Swedish (6.0%, a difference of 0.080%).
| Demographics | Rating | Rank | Ambulatory Disability |
| Immigrants | Costa Rica | 89.5 /100 | #131 | Excellent 5.9% |
| Immigrants | Europe | 87.8 /100 | #132 | Excellent 6.0% |
| Immigrants | Immigrants | 86.9 /100 | #133 | Excellent 6.0% |
| Ute | 86.6 /100 | #134 | Excellent 6.0% |
| Immigrants | Italy | 85.0 /100 | #135 | Excellent 6.0% |
| Immigrants | North Macedonia | 84.1 /100 | #136 | Excellent 6.0% |
| Immigrants | Syria | 84.1 /100 | #137 | Excellent 6.0% |
| Immigrants | Hungary | 83.9 /100 | #138 | Excellent 6.0% |
| Immigrants | Zaire | 83.6 /100 | #139 | Excellent 6.0% |
| Czechs | 83.3 /100 | #140 | Excellent 6.0% |
| Swedes | 83.1 /100 | #141 | Excellent 6.0% |
| Immigrants | Philippines | 83.0 /100 | #142 | Excellent 6.0% |
| Romanians | 82.9 /100 | #143 | Excellent 6.0% |
| Macedonians | 82.8 /100 | #144 | Excellent 6.0% |
| Pakistanis | 82.5 /100 | #145 | Excellent 6.0% |
Demographics Similar to Germans by Ambulatory Disability
In terms of ambulatory disability, the demographic groups most similar to Germans are Immigrants from Panama (6.5%, a difference of 0.0%), Spaniard (6.5%, a difference of 0.020%), Tlingit-Haida (6.5%, a difference of 0.040%), Immigrants from Haiti (6.5%, a difference of 0.050%), and Armenian (6.5%, a difference of 0.050%).
| Demographics | Rating | Rank | Ambulatory Disability |
| Dutch | 2.0 /100 | #236 | Tragic 6.4% |
| Immigrants | Germany | 1.8 /100 | #237 | Tragic 6.4% |
| Haitians | 1.8 /100 | #238 | Tragic 6.4% |
| Senegalese | 1.7 /100 | #239 | Tragic 6.4% |
| Immigrants | Senegal | 1.7 /100 | #240 | Tragic 6.4% |
| Immigrants | Haiti | 1.6 /100 | #241 | Tragic 6.5% |
| Spaniards | 1.6 /100 | #242 | Tragic 6.5% |
| Germans | 1.5 /100 | #243 | Tragic 6.5% |
| Immigrants | Panama | 1.5 /100 | #244 | Tragic 6.5% |
| Tlingit-Haida | 1.5 /100 | #245 | Tragic 6.5% |
| Armenians | 1.5 /100 | #246 | Tragic 6.5% |
| Immigrants | Cuba | 1.4 /100 | #247 | Tragic 6.5% |
| Immigrants | Portugal | 1.4 /100 | #248 | Tragic 6.5% |
| Native Hawaiians | 1.1 /100 | #249 | Tragic 6.5% |
| Chinese | 1.0 /100 | #250 | Tragic 6.5% |