Immigrants from Hungary vs Argentinean Ambulatory Disability
COMPARE
Immigrants from Hungary
Argentinean
Ambulatory Disability
Ambulatory Disability Comparison
Immigrants from Hungary
Argentineans
6.0%
AMBULATORY DISABILITY
83.9/ 100
METRIC RATING
138th/ 347
METRIC RANK
5.5%
AMBULATORY DISABILITY
99.9/ 100
METRIC RATING
42nd/ 347
METRIC RANK
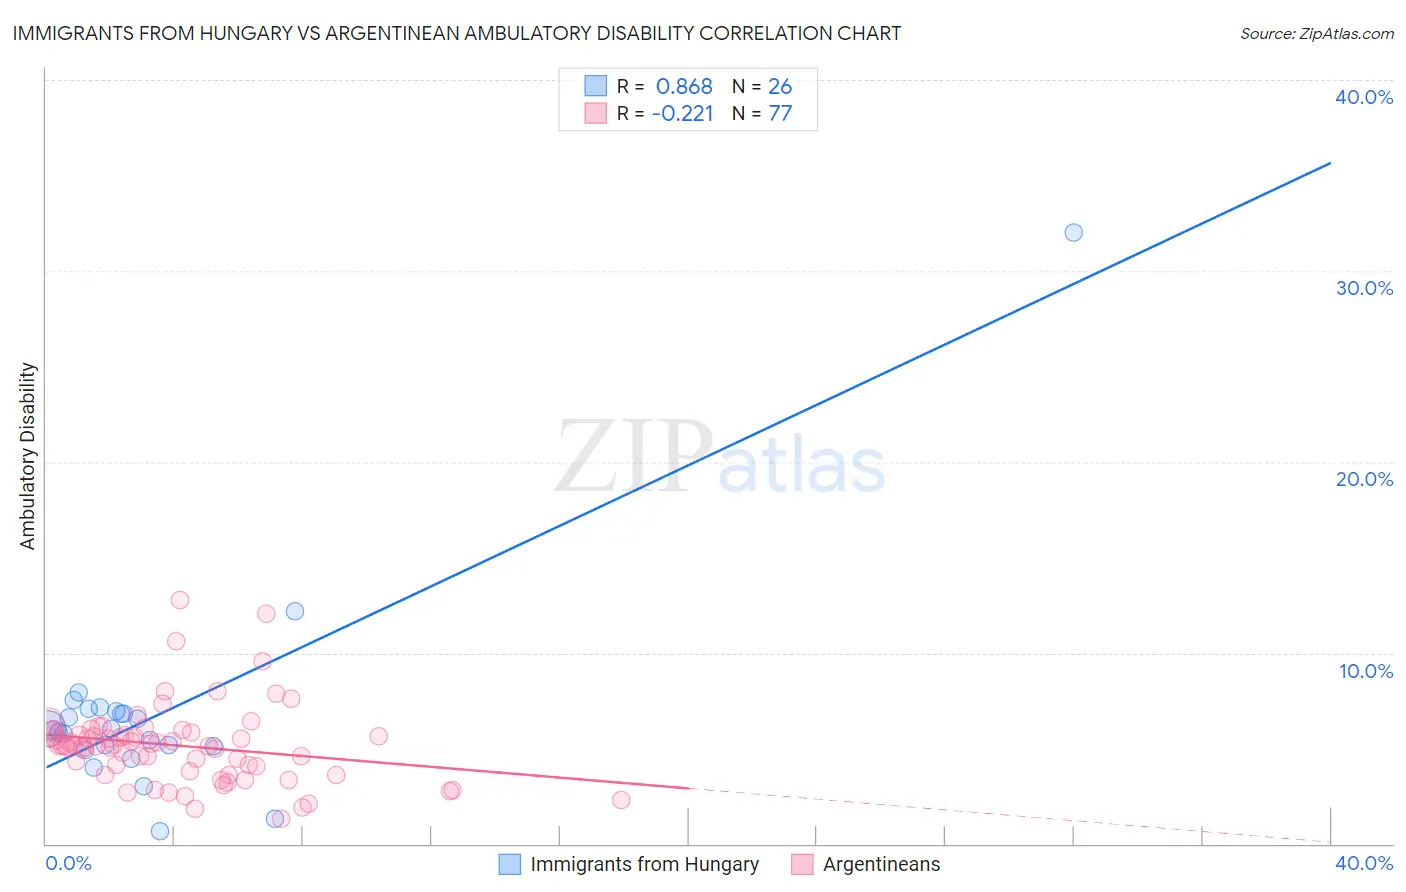
Immigrants from Hungary vs Argentinean Ambulatory Disability Correlation Chart
The statistical analysis conducted on geographies consisting of 195,671,605 people shows a very strong positive correlation between the proportion of Immigrants from Hungary and percentage of population with ambulatory disability in the United States with a correlation coefficient (R) of 0.868 and weighted average of 6.0%. Similarly, the statistical analysis conducted on geographies consisting of 297,088,064 people shows a weak negative correlation between the proportion of Argentineans and percentage of population with ambulatory disability in the United States with a correlation coefficient (R) of -0.221 and weighted average of 5.5%, a difference of 8.6%.
Ambulatory Disability Correlation Summary
| Measurement | Immigrants from Hungary | Argentinean |
| Minimum | 0.66% | 1.3% |
| Maximum | 32.0% | 12.8% |
| Range | 31.3% | 11.5% |
| Mean | 6.8% | 5.1% |
| Median | 6.0% | 5.1% |
| Interquartile 25% (IQ1) | 5.1% | 3.7% |
| Interquartile 75% (IQ3) | 7.0% | 5.8% |
| Interquartile Range (IQR) | 1.9% | 2.1% |
| Standard Deviation (Sample) | 5.6% | 2.1% |
| Standard Deviation (Population) | 5.5% | 2.1% |
Similar Demographics by Ambulatory Disability
Demographics Similar to Immigrants from Hungary by Ambulatory Disability
In terms of ambulatory disability, the demographic groups most similar to Immigrants from Hungary are Immigrants from North Macedonia (6.0%, a difference of 0.020%), Immigrants from Syria (6.0%, a difference of 0.020%), Immigrants from Zaire (6.0%, a difference of 0.030%), Czech (6.0%, a difference of 0.060%), and Swedish (6.0%, a difference of 0.080%).
| Demographics | Rating | Rank | Ambulatory Disability |
| Immigrants | Costa Rica | 89.5 /100 | #131 | Excellent 5.9% |
| Immigrants | Europe | 87.8 /100 | #132 | Excellent 6.0% |
| Immigrants | Immigrants | 86.9 /100 | #133 | Excellent 6.0% |
| Ute | 86.6 /100 | #134 | Excellent 6.0% |
| Immigrants | Italy | 85.0 /100 | #135 | Excellent 6.0% |
| Immigrants | North Macedonia | 84.1 /100 | #136 | Excellent 6.0% |
| Immigrants | Syria | 84.1 /100 | #137 | Excellent 6.0% |
| Immigrants | Hungary | 83.9 /100 | #138 | Excellent 6.0% |
| Immigrants | Zaire | 83.6 /100 | #139 | Excellent 6.0% |
| Czechs | 83.3 /100 | #140 | Excellent 6.0% |
| Swedes | 83.1 /100 | #141 | Excellent 6.0% |
| Immigrants | Philippines | 83.0 /100 | #142 | Excellent 6.0% |
| Romanians | 82.9 /100 | #143 | Excellent 6.0% |
| Macedonians | 82.8 /100 | #144 | Excellent 6.0% |
| Pakistanis | 82.5 /100 | #145 | Excellent 6.0% |
Demographics Similar to Argentineans by Ambulatory Disability
In terms of ambulatory disability, the demographic groups most similar to Argentineans are Mongolian (5.5%, a difference of 0.080%), Venezuelan (5.5%, a difference of 0.16%), Immigrants from Eritrea (5.5%, a difference of 0.50%), Paraguayan (5.5%, a difference of 0.54%), and Turkish (5.5%, a difference of 0.59%).
| Demographics | Rating | Rank | Ambulatory Disability |
| Afghans | 100.0 /100 | #35 | Exceptional 5.5% |
| Immigrants | Malaysia | 100.0 /100 | #36 | Exceptional 5.5% |
| Turks | 100.0 /100 | #37 | Exceptional 5.5% |
| Cypriots | 100.0 /100 | #38 | Exceptional 5.5% |
| Immigrants | Eritrea | 100.0 /100 | #39 | Exceptional 5.5% |
| Venezuelans | 99.9 /100 | #40 | Exceptional 5.5% |
| Mongolians | 99.9 /100 | #41 | Exceptional 5.5% |
| Argentineans | 99.9 /100 | #42 | Exceptional 5.5% |
| Paraguayans | 99.9 /100 | #43 | Exceptional 5.5% |
| Immigrants | Indonesia | 99.9 /100 | #44 | Exceptional 5.5% |
| Immigrants | Sweden | 99.9 /100 | #45 | Exceptional 5.6% |
| Egyptians | 99.9 /100 | #46 | Exceptional 5.6% |
| Immigrants | Japan | 99.9 /100 | #47 | Exceptional 5.6% |
| Immigrants | Argentina | 99.9 /100 | #48 | Exceptional 5.6% |
| Bulgarians | 99.9 /100 | #49 | Exceptional 5.6% |