Moroccan vs German Ambulatory Disability
COMPARE
Moroccan
German
Ambulatory Disability
Ambulatory Disability Comparison
Moroccans
Germans
6.1%
AMBULATORY DISABILITY
52.6/ 100
METRIC RATING
171st/ 347
METRIC RANK
6.5%
AMBULATORY DISABILITY
1.5/ 100
METRIC RATING
243rd/ 347
METRIC RANK
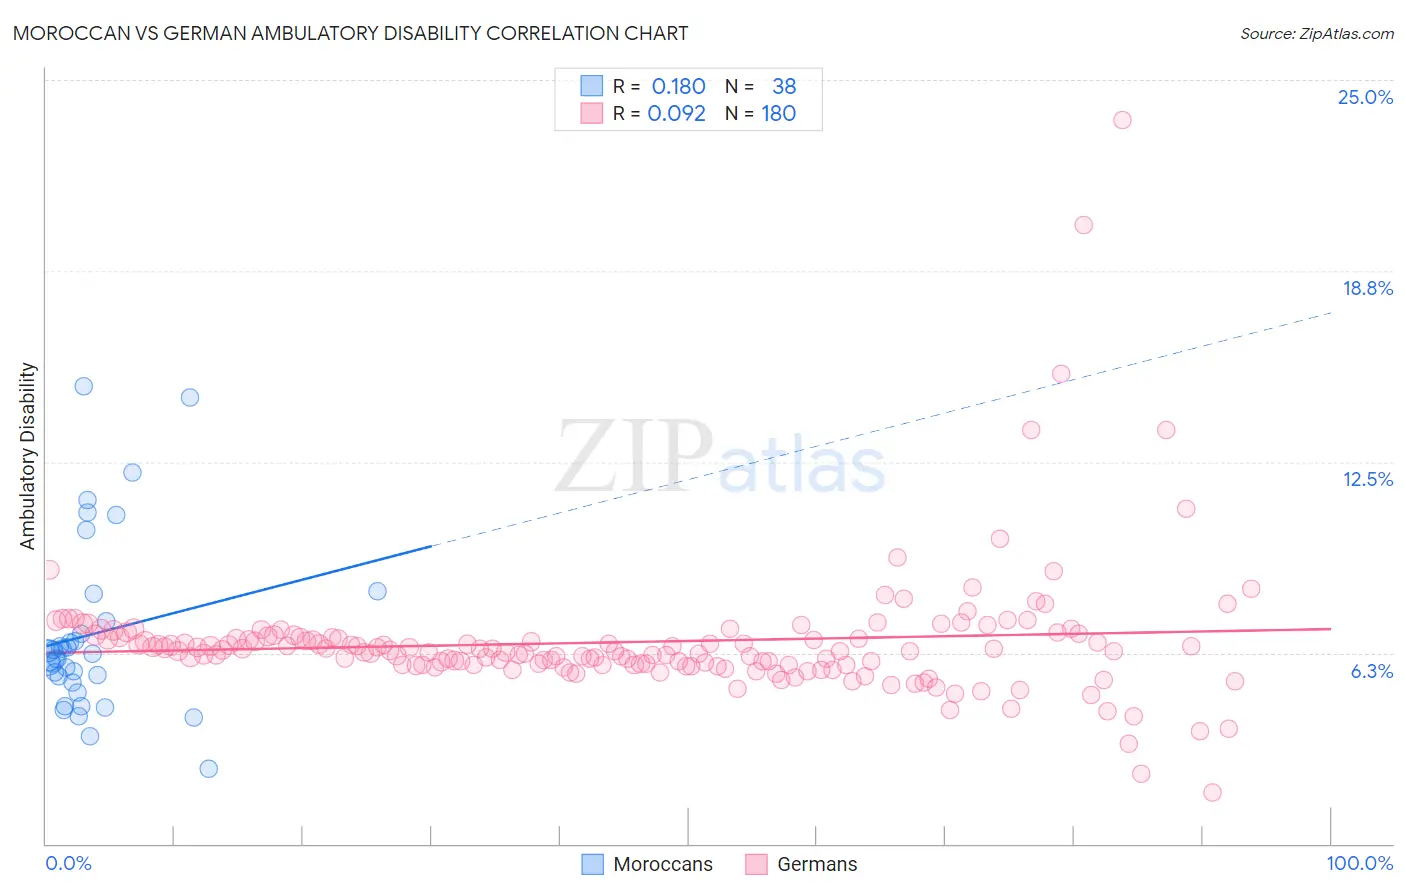
Moroccan vs German Ambulatory Disability Correlation Chart
The statistical analysis conducted on geographies consisting of 201,789,132 people shows a poor positive correlation between the proportion of Moroccans and percentage of population with ambulatory disability in the United States with a correlation coefficient (R) of 0.180 and weighted average of 6.1%. Similarly, the statistical analysis conducted on geographies consisting of 580,433,029 people shows a slight positive correlation between the proportion of Germans and percentage of population with ambulatory disability in the United States with a correlation coefficient (R) of 0.092 and weighted average of 6.5%, a difference of 5.7%.
Ambulatory Disability Correlation Summary
| Measurement | Moroccan | German |
| Minimum | 2.5% | 1.7% |
| Maximum | 15.0% | 23.7% |
| Range | 12.5% | 22.0% |
| Mean | 6.9% | 6.6% |
| Median | 6.2% | 6.3% |
| Interquartile 25% (IQ1) | 5.3% | 5.9% |
| Interquartile 75% (IQ3) | 7.3% | 6.8% |
| Interquartile Range (IQR) | 2.0% | 0.93% |
| Standard Deviation (Sample) | 2.9% | 2.2% |
| Standard Deviation (Population) | 2.8% | 2.2% |
Similar Demographics by Ambulatory Disability
Demographics Similar to Moroccans by Ambulatory Disability
In terms of ambulatory disability, the demographic groups most similar to Moroccans are Immigrants from Burma/Myanmar (6.1%, a difference of 0.020%), Immigrants from Ecuador (6.1%, a difference of 0.070%), Croatian (6.1%, a difference of 0.080%), Immigrants from Canada (6.1%, a difference of 0.14%), and Immigrants from Southern Europe (6.1%, a difference of 0.29%).
| Demographics | Rating | Rank | Ambulatory Disability |
| Basques | 63.7 /100 | #164 | Good 6.1% |
| Nicaraguans | 63.2 /100 | #165 | Good 6.1% |
| Iraqis | 62.8 /100 | #166 | Good 6.1% |
| Immigrants | Oceania | 60.7 /100 | #167 | Good 6.1% |
| Ecuadorians | 60.5 /100 | #168 | Good 6.1% |
| Immigrants | Southern Europe | 58.1 /100 | #169 | Average 6.1% |
| Immigrants | Ecuador | 53.8 /100 | #170 | Average 6.1% |
| Moroccans | 52.6 /100 | #171 | Average 6.1% |
| Immigrants | Burma/Myanmar | 52.2 /100 | #172 | Average 6.1% |
| Croatians | 51.2 /100 | #173 | Average 6.1% |
| Immigrants | Canada | 50.0 /100 | #174 | Average 6.1% |
| Vietnamese | 47.2 /100 | #175 | Average 6.1% |
| Immigrants | North America | 45.6 /100 | #176 | Average 6.1% |
| Immigrants | England | 45.4 /100 | #177 | Average 6.1% |
| Scandinavians | 44.5 /100 | #178 | Average 6.1% |
Demographics Similar to Germans by Ambulatory Disability
In terms of ambulatory disability, the demographic groups most similar to Germans are Immigrants from Panama (6.5%, a difference of 0.0%), Spaniard (6.5%, a difference of 0.020%), Tlingit-Haida (6.5%, a difference of 0.040%), Immigrants from Haiti (6.5%, a difference of 0.050%), and Armenian (6.5%, a difference of 0.050%).
| Demographics | Rating | Rank | Ambulatory Disability |
| Dutch | 2.0 /100 | #236 | Tragic 6.4% |
| Immigrants | Germany | 1.8 /100 | #237 | Tragic 6.4% |
| Haitians | 1.8 /100 | #238 | Tragic 6.4% |
| Senegalese | 1.7 /100 | #239 | Tragic 6.4% |
| Immigrants | Senegal | 1.7 /100 | #240 | Tragic 6.4% |
| Immigrants | Haiti | 1.6 /100 | #241 | Tragic 6.5% |
| Spaniards | 1.6 /100 | #242 | Tragic 6.5% |
| Germans | 1.5 /100 | #243 | Tragic 6.5% |
| Immigrants | Panama | 1.5 /100 | #244 | Tragic 6.5% |
| Tlingit-Haida | 1.5 /100 | #245 | Tragic 6.5% |
| Armenians | 1.5 /100 | #246 | Tragic 6.5% |
| Immigrants | Cuba | 1.4 /100 | #247 | Tragic 6.5% |
| Immigrants | Portugal | 1.4 /100 | #248 | Tragic 6.5% |
| Native Hawaiians | 1.1 /100 | #249 | Tragic 6.5% |
| Chinese | 1.0 /100 | #250 | Tragic 6.5% |