Swedish vs Argentinean Ambulatory Disability
COMPARE
Swedish
Argentinean
Ambulatory Disability
Ambulatory Disability Comparison
Swedes
Argentineans
6.0%
AMBULATORY DISABILITY
83.1/ 100
METRIC RATING
141st/ 347
METRIC RANK
5.5%
AMBULATORY DISABILITY
99.9/ 100
METRIC RATING
42nd/ 347
METRIC RANK
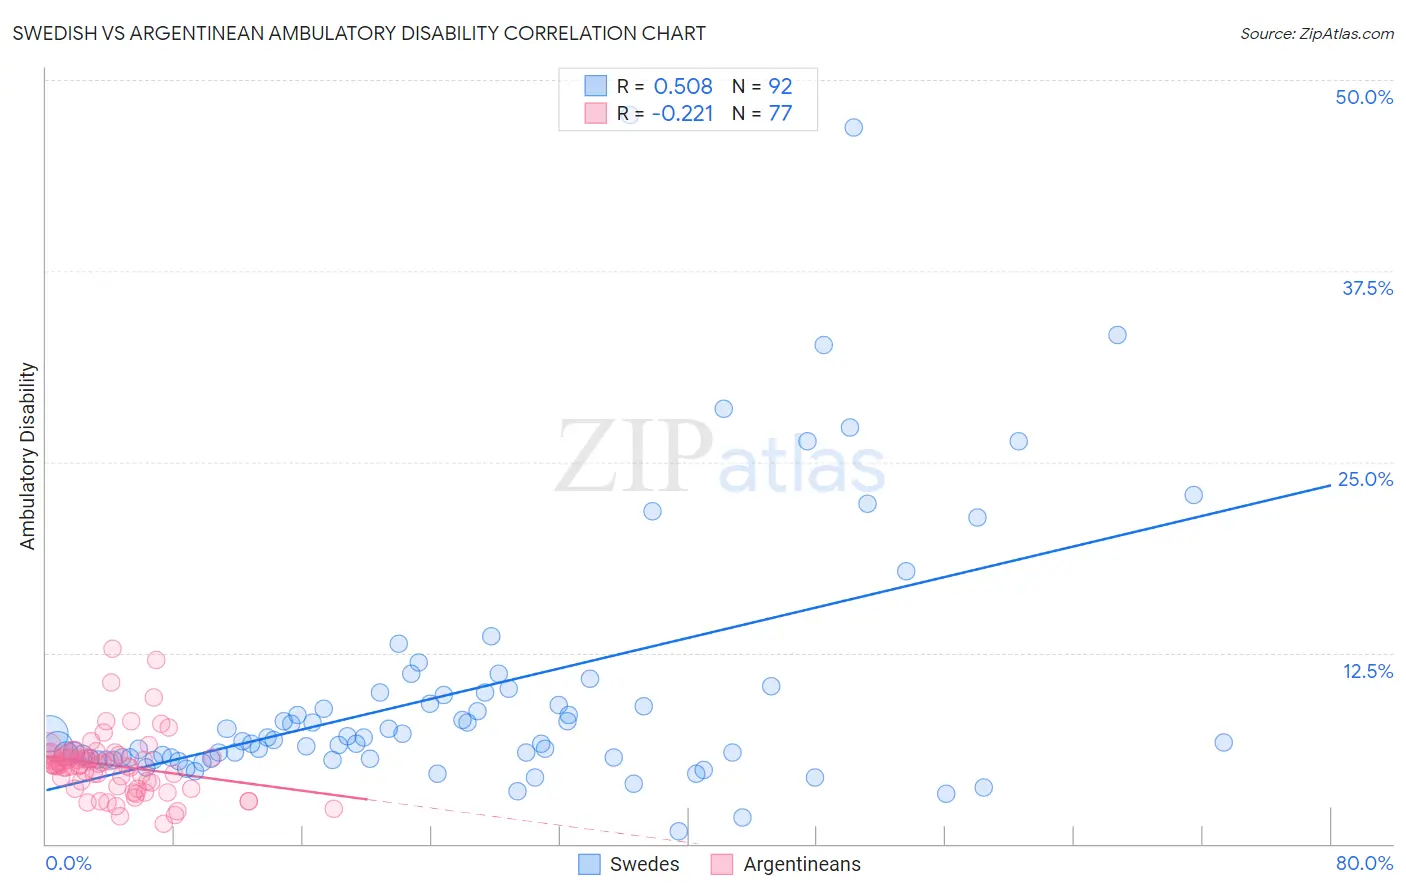
Swedish vs Argentinean Ambulatory Disability Correlation Chart
The statistical analysis conducted on geographies consisting of 538,852,545 people shows a substantial positive correlation between the proportion of Swedes and percentage of population with ambulatory disability in the United States with a correlation coefficient (R) of 0.508 and weighted average of 6.0%. Similarly, the statistical analysis conducted on geographies consisting of 297,088,064 people shows a weak negative correlation between the proportion of Argentineans and percentage of population with ambulatory disability in the United States with a correlation coefficient (R) of -0.221 and weighted average of 5.5%, a difference of 8.7%.
Ambulatory Disability Correlation Summary
| Measurement | Swedish | Argentinean |
| Minimum | 0.84% | 1.3% |
| Maximum | 47.7% | 12.8% |
| Range | 46.9% | 11.5% |
| Mean | 9.9% | 5.1% |
| Median | 6.7% | 5.1% |
| Interquartile 25% (IQ1) | 5.6% | 3.7% |
| Interquartile 75% (IQ3) | 9.8% | 5.8% |
| Interquartile Range (IQR) | 4.3% | 2.1% |
| Standard Deviation (Sample) | 8.7% | 2.1% |
| Standard Deviation (Population) | 8.6% | 2.1% |
Similar Demographics by Ambulatory Disability
Demographics Similar to Swedes by Ambulatory Disability
In terms of ambulatory disability, the demographic groups most similar to Swedes are Immigrants from Philippines (6.0%, a difference of 0.010%), Czech (6.0%, a difference of 0.020%), Romanian (6.0%, a difference of 0.020%), Macedonian (6.0%, a difference of 0.030%), and Immigrants from Zaire (6.0%, a difference of 0.050%).
| Demographics | Rating | Rank | Ambulatory Disability |
| Ute | 86.6 /100 | #134 | Excellent 6.0% |
| Immigrants | Italy | 85.0 /100 | #135 | Excellent 6.0% |
| Immigrants | North Macedonia | 84.1 /100 | #136 | Excellent 6.0% |
| Immigrants | Syria | 84.1 /100 | #137 | Excellent 6.0% |
| Immigrants | Hungary | 83.9 /100 | #138 | Excellent 6.0% |
| Immigrants | Zaire | 83.6 /100 | #139 | Excellent 6.0% |
| Czechs | 83.3 /100 | #140 | Excellent 6.0% |
| Swedes | 83.1 /100 | #141 | Excellent 6.0% |
| Immigrants | Philippines | 83.0 /100 | #142 | Excellent 6.0% |
| Romanians | 82.9 /100 | #143 | Excellent 6.0% |
| Macedonians | 82.8 /100 | #144 | Excellent 6.0% |
| Pakistanis | 82.5 /100 | #145 | Excellent 6.0% |
| Immigrants | Greece | 82.5 /100 | #146 | Excellent 6.0% |
| Immigrants | Moldova | 82.4 /100 | #147 | Excellent 6.0% |
| Immigrants | Eastern Europe | 82.0 /100 | #148 | Excellent 6.0% |
Demographics Similar to Argentineans by Ambulatory Disability
In terms of ambulatory disability, the demographic groups most similar to Argentineans are Mongolian (5.5%, a difference of 0.080%), Venezuelan (5.5%, a difference of 0.16%), Immigrants from Eritrea (5.5%, a difference of 0.50%), Paraguayan (5.5%, a difference of 0.54%), and Turkish (5.5%, a difference of 0.59%).
| Demographics | Rating | Rank | Ambulatory Disability |
| Afghans | 100.0 /100 | #35 | Exceptional 5.5% |
| Immigrants | Malaysia | 100.0 /100 | #36 | Exceptional 5.5% |
| Turks | 100.0 /100 | #37 | Exceptional 5.5% |
| Cypriots | 100.0 /100 | #38 | Exceptional 5.5% |
| Immigrants | Eritrea | 100.0 /100 | #39 | Exceptional 5.5% |
| Venezuelans | 99.9 /100 | #40 | Exceptional 5.5% |
| Mongolians | 99.9 /100 | #41 | Exceptional 5.5% |
| Argentineans | 99.9 /100 | #42 | Exceptional 5.5% |
| Paraguayans | 99.9 /100 | #43 | Exceptional 5.5% |
| Immigrants | Indonesia | 99.9 /100 | #44 | Exceptional 5.5% |
| Immigrants | Sweden | 99.9 /100 | #45 | Exceptional 5.6% |
| Egyptians | 99.9 /100 | #46 | Exceptional 5.6% |
| Immigrants | Japan | 99.9 /100 | #47 | Exceptional 5.6% |
| Immigrants | Argentina | 99.9 /100 | #48 | Exceptional 5.6% |
| Bulgarians | 99.9 /100 | #49 | Exceptional 5.6% |