Bermudan vs Argentinean Ambulatory Disability
COMPARE
Bermudan
Argentinean
Ambulatory Disability
Ambulatory Disability Comparison
Bermudans
Argentineans
6.5%
AMBULATORY DISABILITY
0.5/ 100
METRIC RATING
257th/ 347
METRIC RANK
5.5%
AMBULATORY DISABILITY
99.9/ 100
METRIC RATING
42nd/ 347
METRIC RANK
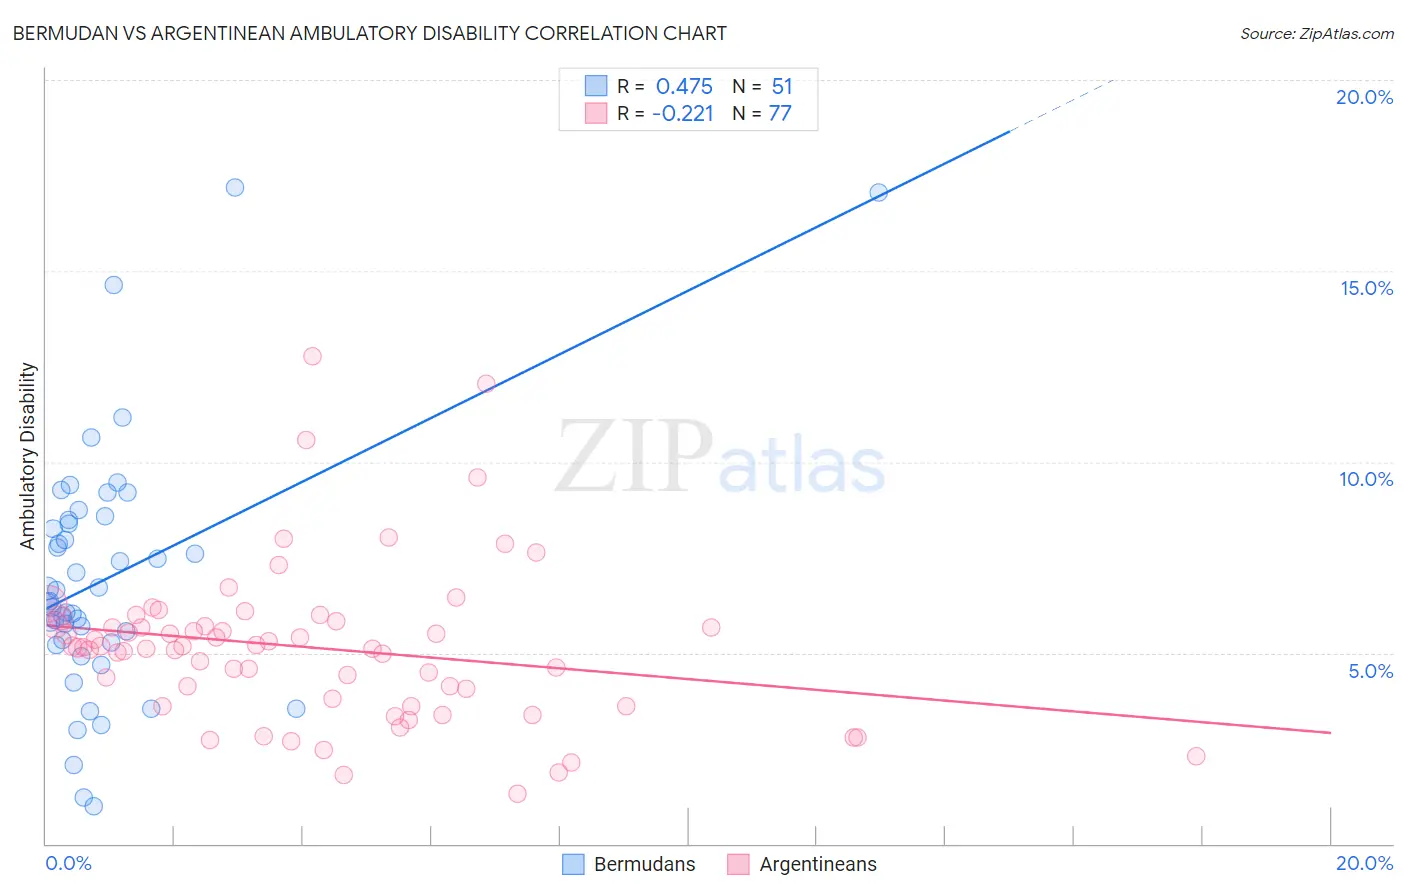
Bermudan vs Argentinean Ambulatory Disability Correlation Chart
The statistical analysis conducted on geographies consisting of 55,721,081 people shows a moderate positive correlation between the proportion of Bermudans and percentage of population with ambulatory disability in the United States with a correlation coefficient (R) of 0.475 and weighted average of 6.5%. Similarly, the statistical analysis conducted on geographies consisting of 297,088,064 people shows a weak negative correlation between the proportion of Argentineans and percentage of population with ambulatory disability in the United States with a correlation coefficient (R) of -0.221 and weighted average of 5.5%, a difference of 18.7%.
Ambulatory Disability Correlation Summary
| Measurement | Bermudan | Argentinean |
| Minimum | 0.98% | 1.3% |
| Maximum | 17.2% | 12.8% |
| Range | 16.2% | 11.5% |
| Mean | 7.0% | 5.1% |
| Median | 6.4% | 5.1% |
| Interquartile 25% (IQ1) | 5.3% | 3.7% |
| Interquartile 75% (IQ3) | 8.5% | 5.8% |
| Interquartile Range (IQR) | 3.2% | 2.1% |
| Standard Deviation (Sample) | 3.3% | 2.1% |
| Standard Deviation (Population) | 3.2% | 2.1% |
Similar Demographics by Ambulatory Disability
Demographics Similar to Bermudans by Ambulatory Disability
In terms of ambulatory disability, the demographic groups most similar to Bermudans are Immigrants from Uzbekistan (6.5%, a difference of 0.080%), Spanish American Indian (6.5%, a difference of 0.080%), Welsh (6.5%, a difference of 0.16%), Belizean (6.5%, a difference of 0.23%), and Aleut (6.6%, a difference of 0.26%).
| Demographics | Rating | Rank | Ambulatory Disability |
| Chinese | 1.0 /100 | #250 | Tragic 6.5% |
| Hawaiians | 0.9 /100 | #251 | Tragic 6.5% |
| Immigrants | Bahamas | 0.8 /100 | #252 | Tragic 6.5% |
| Scottish | 0.7 /100 | #253 | Tragic 6.5% |
| Belizeans | 0.7 /100 | #254 | Tragic 6.5% |
| Welsh | 0.6 /100 | #255 | Tragic 6.5% |
| Immigrants | Uzbekistan | 0.6 /100 | #256 | Tragic 6.5% |
| Bermudans | 0.5 /100 | #257 | Tragic 6.5% |
| Spanish American Indians | 0.5 /100 | #258 | Tragic 6.5% |
| Aleuts | 0.4 /100 | #259 | Tragic 6.6% |
| Immigrants | Belize | 0.4 /100 | #260 | Tragic 6.6% |
| Irish | 0.4 /100 | #261 | Tragic 6.6% |
| English | 0.4 /100 | #262 | Tragic 6.6% |
| Hmong | 0.3 /100 | #263 | Tragic 6.6% |
| Nepalese | 0.2 /100 | #264 | Tragic 6.6% |
Demographics Similar to Argentineans by Ambulatory Disability
In terms of ambulatory disability, the demographic groups most similar to Argentineans are Mongolian (5.5%, a difference of 0.080%), Venezuelan (5.5%, a difference of 0.16%), Immigrants from Eritrea (5.5%, a difference of 0.50%), Paraguayan (5.5%, a difference of 0.54%), and Turkish (5.5%, a difference of 0.59%).
| Demographics | Rating | Rank | Ambulatory Disability |
| Afghans | 100.0 /100 | #35 | Exceptional 5.5% |
| Immigrants | Malaysia | 100.0 /100 | #36 | Exceptional 5.5% |
| Turks | 100.0 /100 | #37 | Exceptional 5.5% |
| Cypriots | 100.0 /100 | #38 | Exceptional 5.5% |
| Immigrants | Eritrea | 100.0 /100 | #39 | Exceptional 5.5% |
| Venezuelans | 99.9 /100 | #40 | Exceptional 5.5% |
| Mongolians | 99.9 /100 | #41 | Exceptional 5.5% |
| Argentineans | 99.9 /100 | #42 | Exceptional 5.5% |
| Paraguayans | 99.9 /100 | #43 | Exceptional 5.5% |
| Immigrants | Indonesia | 99.9 /100 | #44 | Exceptional 5.5% |
| Immigrants | Sweden | 99.9 /100 | #45 | Exceptional 5.6% |
| Egyptians | 99.9 /100 | #46 | Exceptional 5.6% |
| Immigrants | Japan | 99.9 /100 | #47 | Exceptional 5.6% |
| Immigrants | Argentina | 99.9 /100 | #48 | Exceptional 5.6% |
| Bulgarians | 99.9 /100 | #49 | Exceptional 5.6% |