Cree vs Argentinean Ambulatory Disability
COMPARE
Cree
Argentinean
Ambulatory Disability
Ambulatory Disability Comparison
Cree
Argentineans
7.1%
AMBULATORY DISABILITY
0.0/ 100
METRIC RATING
311th/ 347
METRIC RANK
5.5%
AMBULATORY DISABILITY
99.9/ 100
METRIC RATING
42nd/ 347
METRIC RANK
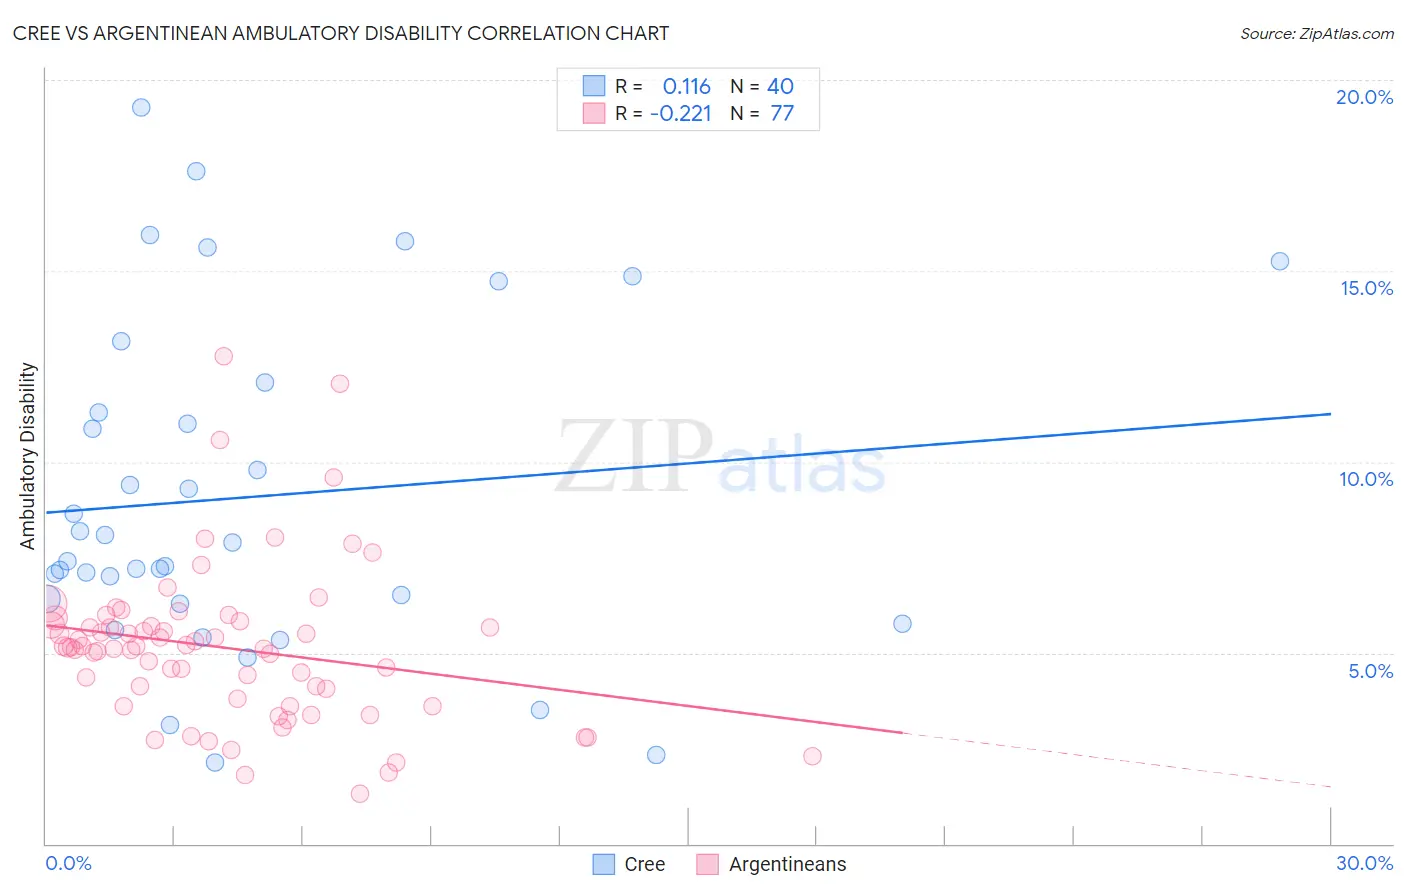
Cree vs Argentinean Ambulatory Disability Correlation Chart
The statistical analysis conducted on geographies consisting of 76,208,414 people shows a poor positive correlation between the proportion of Cree and percentage of population with ambulatory disability in the United States with a correlation coefficient (R) of 0.116 and weighted average of 7.1%. Similarly, the statistical analysis conducted on geographies consisting of 297,088,064 people shows a weak negative correlation between the proportion of Argentineans and percentage of population with ambulatory disability in the United States with a correlation coefficient (R) of -0.221 and weighted average of 5.5%, a difference of 28.9%.
Ambulatory Disability Correlation Summary
| Measurement | Cree | Argentinean |
| Minimum | 2.1% | 1.3% |
| Maximum | 19.3% | 12.8% |
| Range | 17.2% | 11.5% |
| Mean | 9.1% | 5.1% |
| Median | 7.7% | 5.1% |
| Interquartile 25% (IQ1) | 6.4% | 3.7% |
| Interquartile 75% (IQ3) | 11.7% | 5.8% |
| Interquartile Range (IQR) | 5.3% | 2.1% |
| Standard Deviation (Sample) | 4.3% | 2.1% |
| Standard Deviation (Population) | 4.3% | 2.1% |
Similar Demographics by Ambulatory Disability
Demographics Similar to Cree by Ambulatory Disability
In terms of ambulatory disability, the demographic groups most similar to Cree are Arapaho (7.1%, a difference of 0.010%), Delaware (7.1%, a difference of 0.22%), Immigrants from the Azores (7.1%, a difference of 0.29%), Immigrants from Yemen (7.1%, a difference of 0.35%), and Blackfeet (7.1%, a difference of 0.38%).
| Demographics | Rating | Rank | Ambulatory Disability |
| Immigrants | Cabo Verde | 0.0 /100 | #304 | Tragic 7.0% |
| Immigrants | Micronesia | 0.0 /100 | #305 | Tragic 7.0% |
| Iroquois | 0.0 /100 | #306 | Tragic 7.1% |
| Spanish Americans | 0.0 /100 | #307 | Tragic 7.1% |
| Chippewa | 0.0 /100 | #308 | Tragic 7.1% |
| Immigrants | Azores | 0.0 /100 | #309 | Tragic 7.1% |
| Arapaho | 0.0 /100 | #310 | Tragic 7.1% |
| Cree | 0.0 /100 | #311 | Tragic 7.1% |
| Delaware | 0.0 /100 | #312 | Tragic 7.1% |
| Immigrants | Yemen | 0.0 /100 | #313 | Tragic 7.1% |
| Blackfeet | 0.0 /100 | #314 | Tragic 7.1% |
| Shoshone | 0.0 /100 | #315 | Tragic 7.1% |
| Immigrants | Dominican Republic | 0.0 /100 | #316 | Tragic 7.1% |
| Central American Indians | 0.0 /100 | #317 | Tragic 7.2% |
| Ottawa | 0.0 /100 | #318 | Tragic 7.2% |
Demographics Similar to Argentineans by Ambulatory Disability
In terms of ambulatory disability, the demographic groups most similar to Argentineans are Mongolian (5.5%, a difference of 0.080%), Venezuelan (5.5%, a difference of 0.16%), Immigrants from Eritrea (5.5%, a difference of 0.50%), Paraguayan (5.5%, a difference of 0.54%), and Turkish (5.5%, a difference of 0.59%).
| Demographics | Rating | Rank | Ambulatory Disability |
| Afghans | 100.0 /100 | #35 | Exceptional 5.5% |
| Immigrants | Malaysia | 100.0 /100 | #36 | Exceptional 5.5% |
| Turks | 100.0 /100 | #37 | Exceptional 5.5% |
| Cypriots | 100.0 /100 | #38 | Exceptional 5.5% |
| Immigrants | Eritrea | 100.0 /100 | #39 | Exceptional 5.5% |
| Venezuelans | 99.9 /100 | #40 | Exceptional 5.5% |
| Mongolians | 99.9 /100 | #41 | Exceptional 5.5% |
| Argentineans | 99.9 /100 | #42 | Exceptional 5.5% |
| Paraguayans | 99.9 /100 | #43 | Exceptional 5.5% |
| Immigrants | Indonesia | 99.9 /100 | #44 | Exceptional 5.5% |
| Immigrants | Sweden | 99.9 /100 | #45 | Exceptional 5.6% |
| Egyptians | 99.9 /100 | #46 | Exceptional 5.6% |
| Immigrants | Japan | 99.9 /100 | #47 | Exceptional 5.6% |
| Immigrants | Argentina | 99.9 /100 | #48 | Exceptional 5.6% |
| Bulgarians | 99.9 /100 | #49 | Exceptional 5.6% |