Immigrants from Hong Kong vs Costa Rican Self-Care Disability
COMPARE
Immigrants from Hong Kong
Costa Rican
Self-Care Disability
Self-Care Disability Comparison
Immigrants from Hong Kong
Costa Ricans
2.4%
SELF-CARE DISABILITY
93.1/ 100
METRIC RATING
115th/ 347
METRIC RANK
2.4%
SELF-CARE DISABILITY
80.8/ 100
METRIC RATING
144th/ 347
METRIC RANK
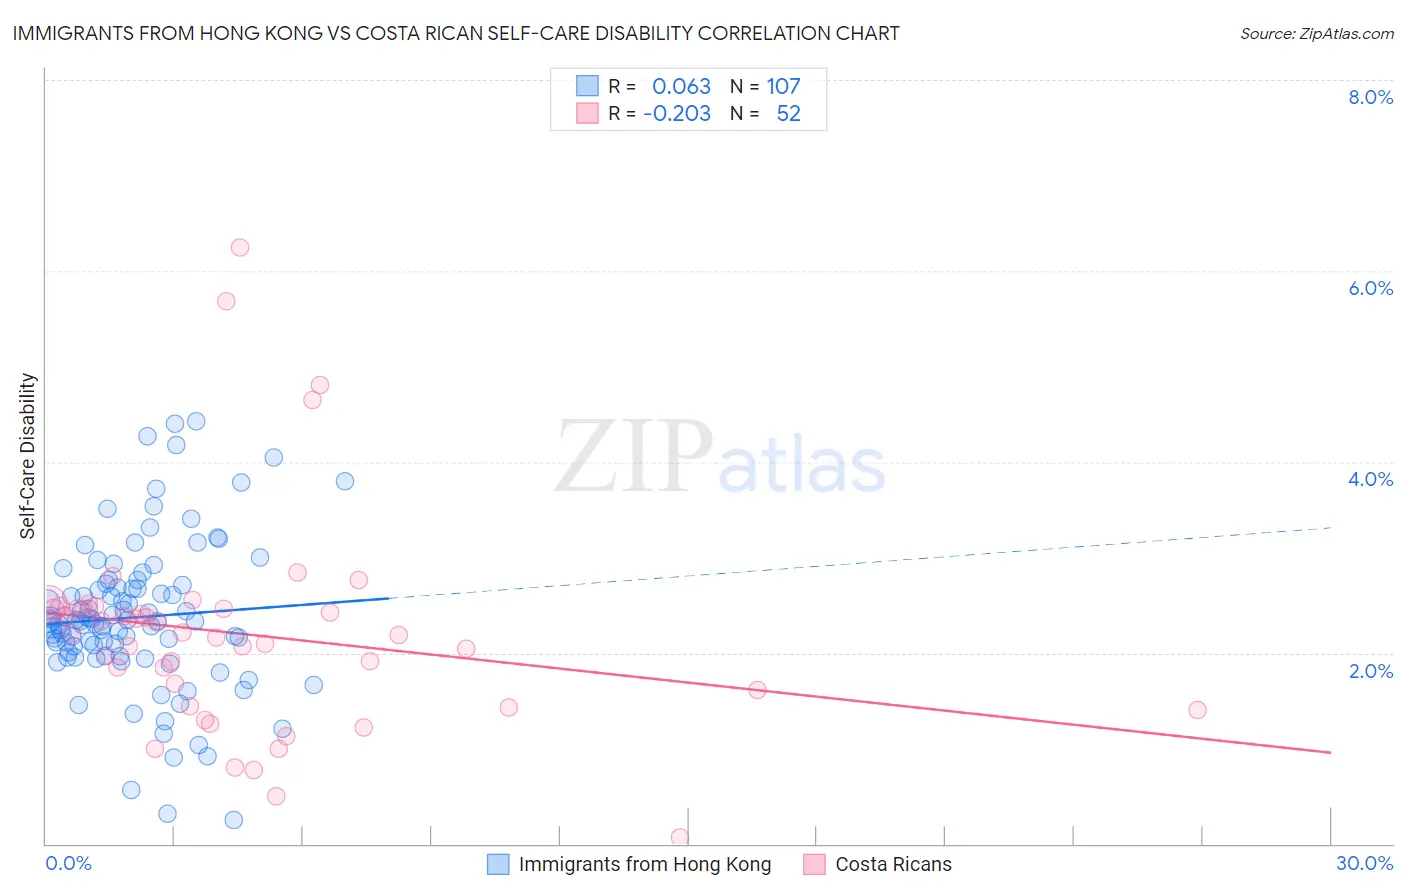
Immigrants from Hong Kong vs Costa Rican Self-Care Disability Correlation Chart
The statistical analysis conducted on geographies consisting of 253,791,593 people shows a slight positive correlation between the proportion of Immigrants from Hong Kong and percentage of population with self-care disability in the United States with a correlation coefficient (R) of 0.063 and weighted average of 2.4%. Similarly, the statistical analysis conducted on geographies consisting of 253,379,189 people shows a weak negative correlation between the proportion of Costa Ricans and percentage of population with self-care disability in the United States with a correlation coefficient (R) of -0.203 and weighted average of 2.4%, a difference of 1.4%.
Self-Care Disability Correlation Summary
| Measurement | Immigrants from Hong Kong | Costa Rican |
| Minimum | 0.25% | 0.069% |
| Maximum | 4.4% | 6.2% |
| Range | 4.2% | 6.2% |
| Mean | 2.4% | 2.2% |
| Median | 2.3% | 2.2% |
| Interquartile 25% (IQ1) | 2.0% | 1.5% |
| Interquartile 75% (IQ3) | 2.7% | 2.5% |
| Interquartile Range (IQR) | 0.75% | 0.94% |
| Standard Deviation (Sample) | 0.79% | 1.1% |
| Standard Deviation (Population) | 0.78% | 1.1% |
Similar Demographics by Self-Care Disability
Demographics Similar to Immigrants from Hong Kong by Self-Care Disability
In terms of self-care disability, the demographic groups most similar to Immigrants from Hong Kong are Immigrants from North Macedonia (2.4%, a difference of 0.0%), South American (2.4%, a difference of 0.010%), Northern European (2.4%, a difference of 0.050%), Scandinavian (2.4%, a difference of 0.070%), and Serbian (2.4%, a difference of 0.090%).
| Demographics | Rating | Rank | Self-Care Disability |
| Greeks | 94.1 /100 | #108 | Exceptional 2.4% |
| Slovenes | 94.1 /100 | #109 | Exceptional 2.4% |
| Immigrants | Africa | 93.7 /100 | #110 | Exceptional 2.4% |
| Serbians | 93.6 /100 | #111 | Exceptional 2.4% |
| Scandinavians | 93.5 /100 | #112 | Exceptional 2.4% |
| South Americans | 93.2 /100 | #113 | Exceptional 2.4% |
| Immigrants | North Macedonia | 93.1 /100 | #114 | Exceptional 2.4% |
| Immigrants | Hong Kong | 93.1 /100 | #115 | Exceptional 2.4% |
| Northern Europeans | 92.9 /100 | #116 | Exceptional 2.4% |
| Taiwanese | 92.5 /100 | #117 | Exceptional 2.4% |
| Immigrants | Canada | 92.0 /100 | #118 | Exceptional 2.4% |
| Immigrants | Sierra Leone | 91.8 /100 | #119 | Exceptional 2.4% |
| Uruguayans | 91.5 /100 | #120 | Exceptional 2.4% |
| Peruvians | 91.3 /100 | #121 | Exceptional 2.4% |
| Belgians | 90.9 /100 | #122 | Exceptional 2.4% |
Demographics Similar to Costa Ricans by Self-Care Disability
In terms of self-care disability, the demographic groups most similar to Costa Ricans are German (2.4%, a difference of 0.050%), Israeli (2.4%, a difference of 0.060%), Afghan (2.4%, a difference of 0.12%), Immigrants from Peru (2.4%, a difference of 0.20%), and Dutch (2.4%, a difference of 0.25%).
| Demographics | Rating | Rank | Self-Care Disability |
| Austrians | 87.0 /100 | #137 | Excellent 2.4% |
| Immigrants | Croatia | 86.6 /100 | #138 | Excellent 2.4% |
| Sri Lankans | 86.6 /100 | #139 | Excellent 2.4% |
| Immigrants | Uruguay | 85.4 /100 | #140 | Excellent 2.4% |
| Alaska Natives | 84.5 /100 | #141 | Excellent 2.4% |
| Immigrants | Peru | 83.2 /100 | #142 | Excellent 2.4% |
| Afghans | 82.3 /100 | #143 | Excellent 2.4% |
| Costa Ricans | 80.8 /100 | #144 | Excellent 2.4% |
| Germans | 80.1 /100 | #145 | Excellent 2.4% |
| Israelis | 80.0 /100 | #146 | Good 2.4% |
| Dutch | 77.5 /100 | #147 | Good 2.4% |
| Romanians | 75.8 /100 | #148 | Good 2.4% |
| Arabs | 75.7 /100 | #149 | Good 2.4% |
| Immigrants | Costa Rica | 75.1 /100 | #150 | Good 2.4% |
| Basques | 74.0 /100 | #151 | Good 2.4% |