Immigrants from Guyana vs Northern European Male Disability
COMPARE
Immigrants from Guyana
Northern European
Male Disability
Male Disability Comparison
Immigrants from Guyana
Northern Europeans
10.6%
MALE DISABILITY
98.2/ 100
METRIC RATING
82nd/ 347
METRIC RANK
11.9%
MALE DISABILITY
1.1/ 100
METRIC RATING
242nd/ 347
METRIC RANK
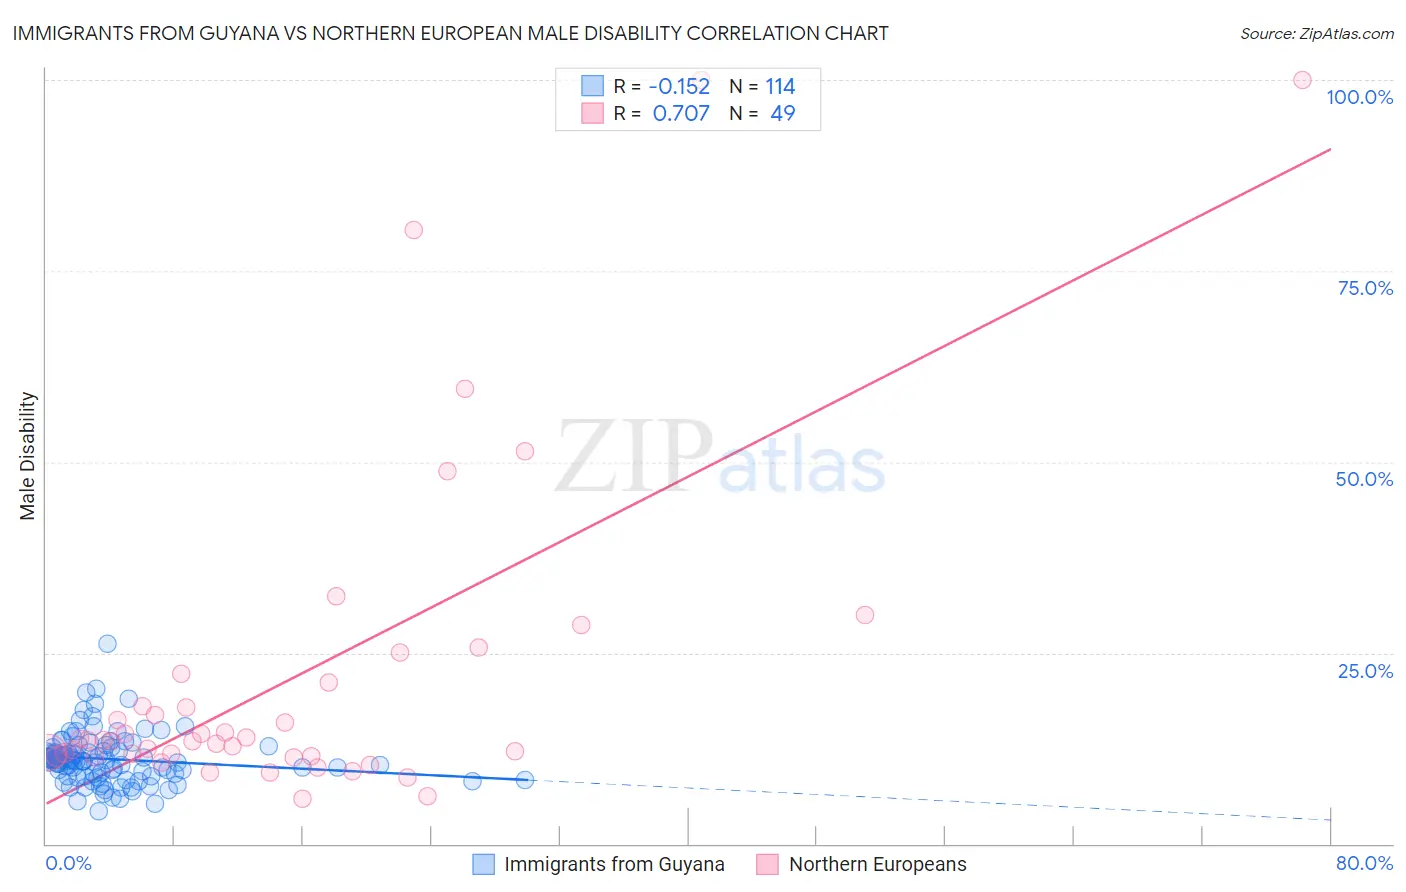
Immigrants from Guyana vs Northern European Male Disability Correlation Chart
The statistical analysis conducted on geographies consisting of 183,704,199 people shows a poor negative correlation between the proportion of Immigrants from Guyana and percentage of males with a disability in the United States with a correlation coefficient (R) of -0.152 and weighted average of 10.6%. Similarly, the statistical analysis conducted on geographies consisting of 406,040,370 people shows a strong positive correlation between the proportion of Northern Europeans and percentage of males with a disability in the United States with a correlation coefficient (R) of 0.707 and weighted average of 11.9%, a difference of 12.5%.
Male Disability Correlation Summary
| Measurement | Immigrants from Guyana | Northern European |
| Minimum | 4.3% | 5.8% |
| Maximum | 26.1% | 100.0% |
| Range | 21.9% | 94.2% |
| Mean | 11.1% | 21.8% |
| Median | 10.9% | 13.6% |
| Interquartile 25% (IQ1) | 9.1% | 11.5% |
| Interquartile 75% (IQ3) | 12.1% | 21.7% |
| Interquartile Range (IQR) | 2.9% | 10.3% |
| Standard Deviation (Sample) | 3.3% | 21.6% |
| Standard Deviation (Population) | 3.3% | 21.4% |
Similar Demographics by Male Disability
Demographics Similar to Immigrants from Guyana by Male Disability
In terms of male disability, the demographic groups most similar to Immigrants from Guyana are Immigrants from Poland (10.6%, a difference of 0.060%), Immigrants from Chile (10.6%, a difference of 0.070%), Bulgarian (10.6%, a difference of 0.080%), Immigrants from Jordan (10.6%, a difference of 0.13%), and Zimbabwean (10.6%, a difference of 0.15%).
| Demographics | Rating | Rank | Male Disability |
| Sierra Leoneans | 98.7 /100 | #75 | Exceptional 10.5% |
| Immigrants | Sierra Leone | 98.7 /100 | #76 | Exceptional 10.5% |
| Laotians | 98.6 /100 | #77 | Exceptional 10.6% |
| Immigrants | Russia | 98.6 /100 | #78 | Exceptional 10.6% |
| Zimbabweans | 98.4 /100 | #79 | Exceptional 10.6% |
| Immigrants | Jordan | 98.4 /100 | #80 | Exceptional 10.6% |
| Immigrants | Chile | 98.3 /100 | #81 | Exceptional 10.6% |
| Immigrants | Guyana | 98.2 /100 | #82 | Exceptional 10.6% |
| Immigrants | Poland | 98.1 /100 | #83 | Exceptional 10.6% |
| Bulgarians | 98.1 /100 | #84 | Exceptional 10.6% |
| Sri Lankans | 97.9 /100 | #85 | Exceptional 10.6% |
| Immigrants | Ireland | 97.9 /100 | #86 | Exceptional 10.6% |
| Immigrants | Vietnam | 97.9 /100 | #87 | Exceptional 10.6% |
| Immigrants | Western Asia | 97.8 /100 | #88 | Exceptional 10.6% |
| Immigrants | Nicaragua | 97.8 /100 | #89 | Exceptional 10.6% |
Demographics Similar to Northern Europeans by Male Disability
In terms of male disability, the demographic groups most similar to Northern Europeans are Bahamian (11.9%, a difference of 0.010%), Samoan (11.9%, a difference of 0.030%), Czech (11.9%, a difference of 0.050%), Italian (11.9%, a difference of 0.10%), and Immigrants from Laos (11.9%, a difference of 0.14%).
| Demographics | Rating | Rank | Male Disability |
| Immigrants | North America | 1.5 /100 | #235 | Tragic 11.9% |
| U.S. Virgin Islanders | 1.3 /100 | #236 | Tragic 11.9% |
| Carpatho Rusyns | 1.3 /100 | #237 | Tragic 11.9% |
| Yugoslavians | 1.2 /100 | #238 | Tragic 11.9% |
| Italians | 1.2 /100 | #239 | Tragic 11.9% |
| Czechs | 1.1 /100 | #240 | Tragic 11.9% |
| Bahamians | 1.1 /100 | #241 | Tragic 11.9% |
| Northern Europeans | 1.1 /100 | #242 | Tragic 11.9% |
| Samoans | 1.1 /100 | #243 | Tragic 11.9% |
| Immigrants | Laos | 1.0 /100 | #244 | Tragic 11.9% |
| Immigrants | Liberia | 1.0 /100 | #245 | Tragic 11.9% |
| Danes | 0.9 /100 | #246 | Tragic 11.9% |
| Hungarians | 0.8 /100 | #247 | Tragic 12.0% |
| Poles | 0.7 /100 | #248 | Tragic 12.0% |
| Immigrants | Yemen | 0.5 /100 | #249 | Tragic 12.0% |