Immigrants from Guyana vs Kiowa Disability Age Over 75
COMPARE
Immigrants from Guyana
Kiowa
Disability Age Over 75
Disability Age Over 75 Comparison
Immigrants from Guyana
Kiowa
47.1%
DISABILITY AGE OVER 75
71.9/ 100
METRIC RATING
158th/ 347
METRIC RANK
54.2%
DISABILITY AGE OVER 75
0.0/ 100
METRIC RATING
335th/ 347
METRIC RANK
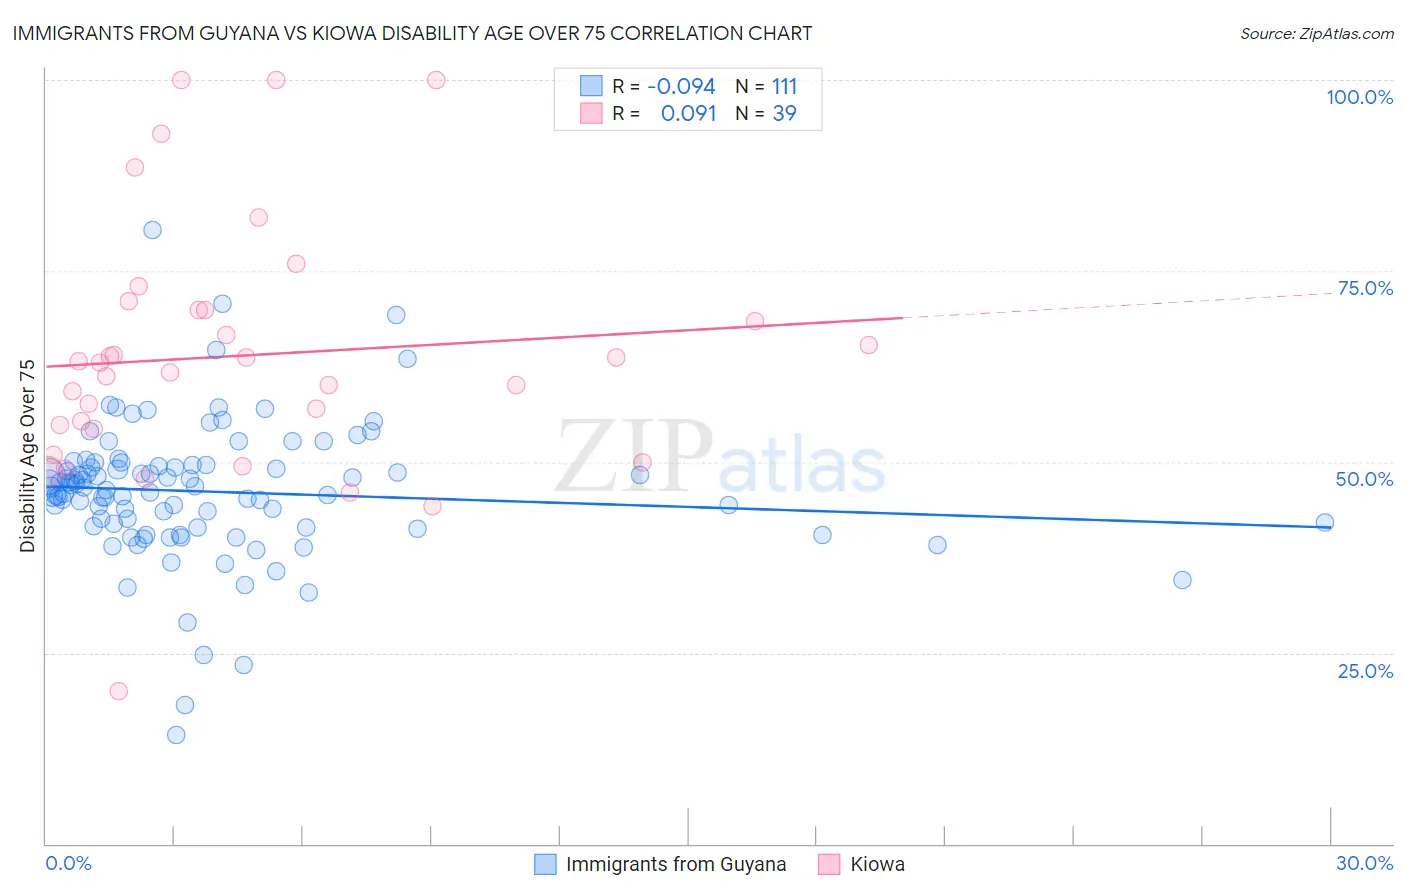
Immigrants from Guyana vs Kiowa Disability Age Over 75 Correlation Chart
The statistical analysis conducted on geographies consisting of 183,514,554 people shows a slight negative correlation between the proportion of Immigrants from Guyana and percentage of population with a disability over the age of 75 in the United States with a correlation coefficient (R) of -0.094 and weighted average of 47.1%. Similarly, the statistical analysis conducted on geographies consisting of 56,070,567 people shows a slight positive correlation between the proportion of Kiowa and percentage of population with a disability over the age of 75 in the United States with a correlation coefficient (R) of 0.091 and weighted average of 54.2%, a difference of 15.2%.
Disability Age Over 75 Correlation Summary
| Measurement | Immigrants from Guyana | Kiowa |
| Minimum | 14.3% | 20.0% |
| Maximum | 80.4% | 100.0% |
| Range | 66.1% | 80.0% |
| Mean | 46.1% | 63.9% |
| Median | 46.7% | 63.0% |
| Interquartile 25% (IQ1) | 41.4% | 54.3% |
| Interquartile 75% (IQ3) | 49.5% | 69.9% |
| Interquartile Range (IQR) | 8.1% | 15.6% |
| Standard Deviation (Sample) | 9.1% | 16.5% |
| Standard Deviation (Population) | 9.1% | 16.3% |
Similar Demographics by Disability Age Over 75
Demographics Similar to Immigrants from Guyana by Disability Age Over 75
In terms of disability age over 75, the demographic groups most similar to Immigrants from Guyana are Immigrants from Morocco (47.1%, a difference of 0.010%), Bhutanese (47.1%, a difference of 0.020%), Arab (47.1%, a difference of 0.040%), Immigrants from Zaire (47.1%, a difference of 0.080%), and Immigrants from Belarus (47.1%, a difference of 0.080%).
| Demographics | Rating | Rank | Disability Age Over 75 |
| French Canadians | 79.0 /100 | #151 | Good 47.0% |
| Immigrants | Asia | 76.5 /100 | #152 | Good 47.0% |
| Immigrants | Zaire | 74.8 /100 | #153 | Good 47.1% |
| Immigrants | Belarus | 74.8 /100 | #154 | Good 47.1% |
| Immigrants | Iran | 74.7 /100 | #155 | Good 47.1% |
| Arabs | 73.3 /100 | #156 | Good 47.1% |
| Bhutanese | 72.6 /100 | #157 | Good 47.1% |
| Immigrants | Guyana | 71.9 /100 | #158 | Good 47.1% |
| Immigrants | Morocco | 71.4 /100 | #159 | Good 47.1% |
| Immigrants | Middle Africa | 68.3 /100 | #160 | Good 47.1% |
| South American Indians | 68.1 /100 | #161 | Good 47.1% |
| Pennsylvania Germans | 66.0 /100 | #162 | Good 47.2% |
| Immigrants | Eastern Africa | 65.5 /100 | #163 | Good 47.2% |
| French | 64.6 /100 | #164 | Good 47.2% |
| Immigrants | Zimbabwe | 64.4 /100 | #165 | Good 47.2% |
Demographics Similar to Kiowa by Disability Age Over 75
In terms of disability age over 75, the demographic groups most similar to Kiowa are Immigrants from Armenia (54.3%, a difference of 0.17%), Yuman (54.4%, a difference of 0.33%), Alaskan Athabascan (54.0%, a difference of 0.53%), Apache (53.6%, a difference of 1.2%), and Colville (55.4%, a difference of 2.1%).
| Demographics | Rating | Rank | Disability Age Over 75 |
| Choctaw | 0.0 /100 | #328 | Tragic 52.7% |
| Alaska Natives | 0.0 /100 | #329 | Tragic 52.8% |
| Puerto Ricans | 0.0 /100 | #330 | Tragic 52.9% |
| Hopi | 0.0 /100 | #331 | Tragic 52.9% |
| Natives/Alaskans | 0.0 /100 | #332 | Tragic 53.1% |
| Apache | 0.0 /100 | #333 | Tragic 53.6% |
| Alaskan Athabascans | 0.0 /100 | #334 | Tragic 54.0% |
| Kiowa | 0.0 /100 | #335 | Tragic 54.2% |
| Immigrants | Armenia | 0.0 /100 | #336 | Tragic 54.3% |
| Yuman | 0.0 /100 | #337 | Tragic 54.4% |
| Colville | 0.0 /100 | #338 | Tragic 55.4% |
| Pima | 0.0 /100 | #339 | Tragic 55.8% |
| Pueblo | 0.0 /100 | #340 | Tragic 55.9% |
| Houma | 0.0 /100 | #341 | Tragic 56.2% |
| Lumbee | 0.0 /100 | #342 | Tragic 56.2% |