Immigrants from Lithuania vs Kiowa Self-Care Disability
COMPARE
Immigrants from Lithuania
Kiowa
Self-Care Disability
Self-Care Disability Comparison
Immigrants from Lithuania
Kiowa
2.3%
SELF-CARE DISABILITY
99.9/ 100
METRIC RATING
36th/ 347
METRIC RANK
3.0%
SELF-CARE DISABILITY
0.0/ 100
METRIC RATING
332nd/ 347
METRIC RANK
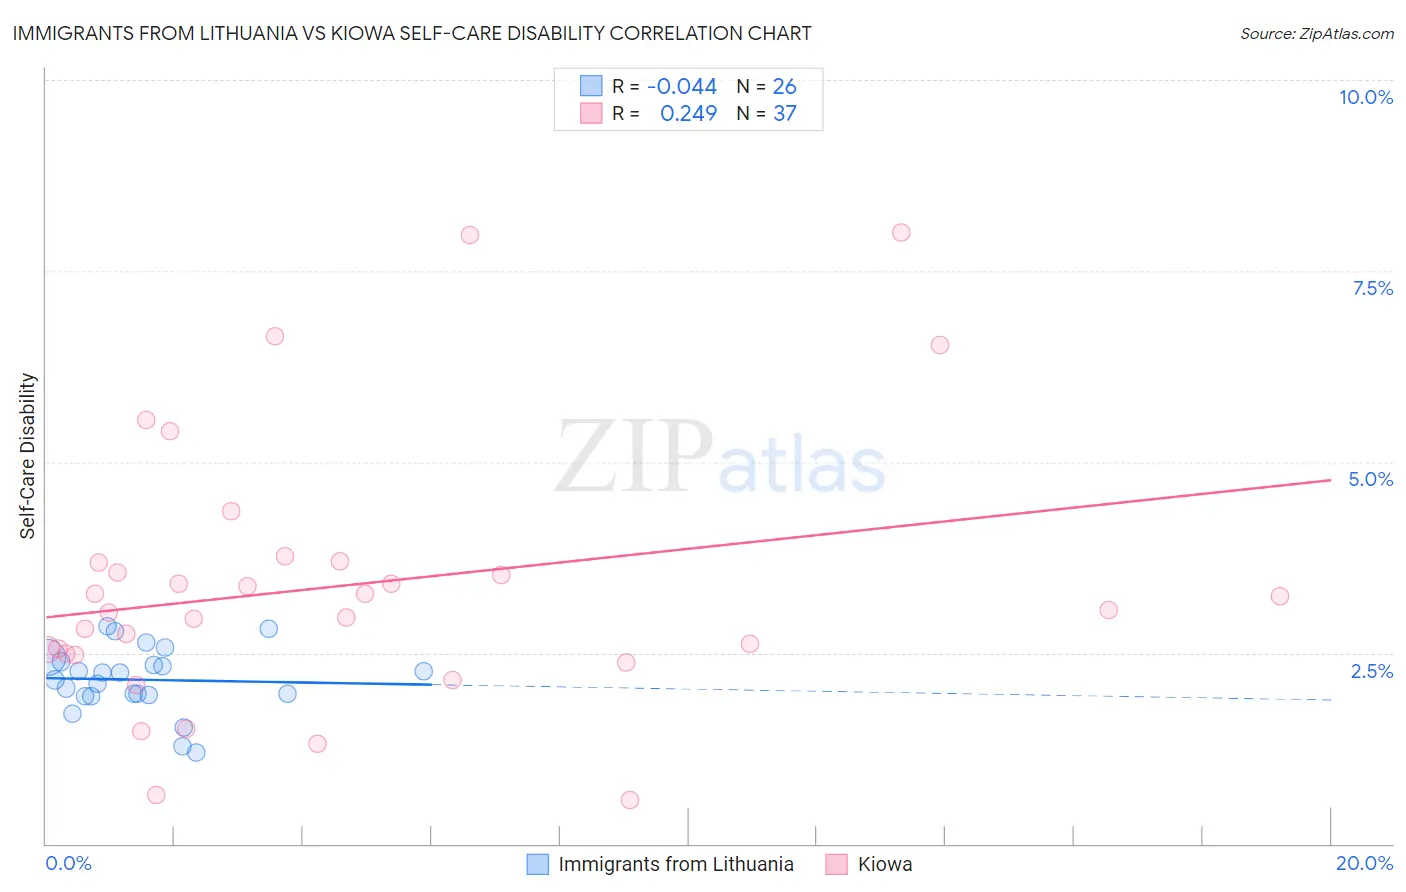
Immigrants from Lithuania vs Kiowa Self-Care Disability Correlation Chart
The statistical analysis conducted on geographies consisting of 117,698,570 people shows no correlation between the proportion of Immigrants from Lithuania and percentage of population with self-care disability in the United States with a correlation coefficient (R) of -0.044 and weighted average of 2.3%. Similarly, the statistical analysis conducted on geographies consisting of 56,085,215 people shows a weak positive correlation between the proportion of Kiowa and percentage of population with self-care disability in the United States with a correlation coefficient (R) of 0.249 and weighted average of 3.0%, a difference of 31.3%.
Self-Care Disability Correlation Summary
| Measurement | Immigrants from Lithuania | Kiowa |
| Minimum | 1.2% | 0.57% |
| Maximum | 2.9% | 8.0% |
| Range | 1.7% | 7.4% |
| Mean | 2.1% | 3.4% |
| Median | 2.2% | 3.1% |
| Interquartile 25% (IQ1) | 2.0% | 2.5% |
| Interquartile 75% (IQ3) | 2.4% | 3.7% |
| Interquartile Range (IQR) | 0.43% | 1.2% |
| Standard Deviation (Sample) | 0.43% | 1.7% |
| Standard Deviation (Population) | 0.42% | 1.7% |
Similar Demographics by Self-Care Disability
Demographics Similar to Immigrants from Lithuania by Self-Care Disability
In terms of self-care disability, the demographic groups most similar to Immigrants from Lithuania are Immigrants from Australia (2.3%, a difference of 0.010%), Immigrants from Turkey (2.3%, a difference of 0.070%), Immigrants from Korea (2.3%, a difference of 0.13%), Immigrants from Sweden (2.3%, a difference of 0.17%), and Immigrants from Eastern Africa (2.3%, a difference of 0.30%).
| Demographics | Rating | Rank | Self-Care Disability |
| Immigrants | Zimbabwe | 99.9 /100 | #29 | Exceptional 2.3% |
| Paraguayans | 99.9 /100 | #30 | Exceptional 2.3% |
| Danes | 99.9 /100 | #31 | Exceptional 2.3% |
| Burmese | 99.9 /100 | #32 | Exceptional 2.3% |
| Immigrants | Korea | 99.9 /100 | #33 | Exceptional 2.3% |
| Immigrants | Turkey | 99.9 /100 | #34 | Exceptional 2.3% |
| Immigrants | Australia | 99.9 /100 | #35 | Exceptional 2.3% |
| Immigrants | Lithuania | 99.9 /100 | #36 | Exceptional 2.3% |
| Immigrants | Sweden | 99.9 /100 | #37 | Exceptional 2.3% |
| Immigrants | Eastern Africa | 99.9 /100 | #38 | Exceptional 2.3% |
| Immigrants | Bulgaria | 99.8 /100 | #39 | Exceptional 2.3% |
| Iranians | 99.8 /100 | #40 | Exceptional 2.3% |
| Immigrants | Sudan | 99.8 /100 | #41 | Exceptional 2.3% |
| Immigrants | Uganda | 99.8 /100 | #42 | Exceptional 2.3% |
| Immigrants | Pakistan | 99.8 /100 | #43 | Exceptional 2.3% |
Demographics Similar to Kiowa by Self-Care Disability
In terms of self-care disability, the demographic groups most similar to Kiowa are Dutch West Indian (3.0%, a difference of 0.23%), Houma (3.0%, a difference of 0.30%), Immigrants from the Azores (3.0%, a difference of 0.35%), Lumbee (3.0%, a difference of 0.36%), and Nepalese (3.0%, a difference of 0.47%).
| Demographics | Rating | Rank | Self-Care Disability |
| Immigrants | Uzbekistan | 0.0 /100 | #325 | Tragic 2.9% |
| Paiute | 0.0 /100 | #326 | Tragic 2.9% |
| Blacks/African Americans | 0.0 /100 | #327 | Tragic 2.9% |
| Hopi | 0.0 /100 | #328 | Tragic 2.9% |
| Cajuns | 0.0 /100 | #329 | Tragic 2.9% |
| Nepalese | 0.0 /100 | #330 | Tragic 3.0% |
| Lumbee | 0.0 /100 | #331 | Tragic 3.0% |
| Kiowa | 0.0 /100 | #332 | Tragic 3.0% |
| Dutch West Indians | 0.0 /100 | #333 | Tragic 3.0% |
| Houma | 0.0 /100 | #334 | Tragic 3.0% |
| Immigrants | Azores | 0.0 /100 | #335 | Tragic 3.0% |
| Immigrants | Yemen | 0.0 /100 | #336 | Tragic 3.0% |
| Choctaw | 0.0 /100 | #337 | Tragic 3.0% |
| Cape Verdeans | 0.0 /100 | #338 | Tragic 3.0% |
| Immigrants | Dominican Republic | 0.0 /100 | #339 | Tragic 3.0% |