Immigrants from Grenada vs Immigrants from Latvia Disability Age Under 5
COMPARE
Immigrants from Grenada
Immigrants from Latvia
Disability Age Under 5
Disability Age Under 5 Comparison
Immigrants from Grenada
Immigrants from Latvia
0.94%
DISABILITY AGE UNDER 5
100.0/ 100
METRIC RATING
12th/ 347
METRIC RANK
1.2%
DISABILITY AGE UNDER 5
50.0/ 100
METRIC RATING
174th/ 347
METRIC RANK
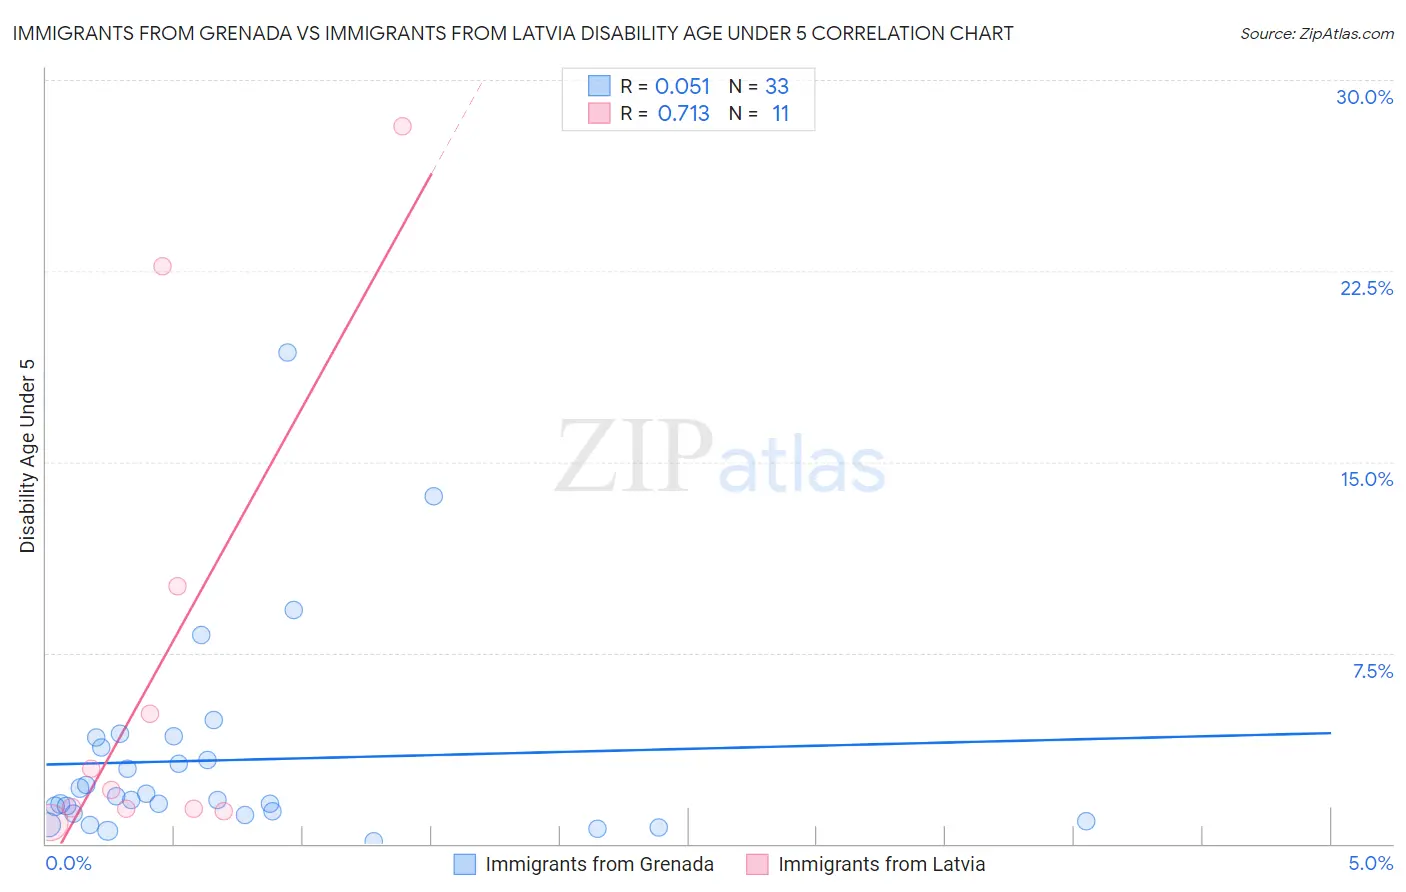
Immigrants from Grenada vs Immigrants from Latvia Disability Age Under 5 Correlation Chart
The statistical analysis conducted on geographies consisting of 49,697,157 people shows a slight positive correlation between the proportion of Immigrants from Grenada and percentage of population with a disability under the age of 5 in the United States with a correlation coefficient (R) of 0.051 and weighted average of 0.94%. Similarly, the statistical analysis conducted on geographies consisting of 82,600,960 people shows a strong positive correlation between the proportion of Immigrants from Latvia and percentage of population with a disability under the age of 5 in the United States with a correlation coefficient (R) of 0.713 and weighted average of 1.2%, a difference of 31.3%.
Disability Age Under 5 Correlation Summary
| Measurement | Immigrants from Grenada | Immigrants from Latvia |
| Minimum | 0.086% | 0.83% |
| Maximum | 19.3% | 28.2% |
| Range | 19.2% | 27.3% |
| Mean | 3.3% | 7.0% |
| Median | 1.7% | 2.1% |
| Interquartile 25% (IQ1) | 1.1% | 1.4% |
| Interquartile 75% (IQ3) | 4.0% | 10.1% |
| Interquartile Range (IQR) | 2.8% | 8.8% |
| Standard Deviation (Sample) | 4.0% | 9.6% |
| Standard Deviation (Population) | 4.0% | 9.1% |
Similar Demographics by Disability Age Under 5
Demographics Similar to Immigrants from Grenada by Disability Age Under 5
In terms of disability age under 5, the demographic groups most similar to Immigrants from Grenada are Afghan (0.94%, a difference of 0.020%), Soviet Union (0.95%, a difference of 0.17%), Yuman (0.95%, a difference of 0.24%), Immigrants from Hong Kong (0.95%, a difference of 0.28%), and Marshallese (0.94%, a difference of 0.78%).
| Demographics | Rating | Rank | Disability Age Under 5 |
| Immigrants | Bangladesh | 100.0 /100 | #5 | Exceptional 0.85% |
| Ute | 100.0 /100 | #6 | Exceptional 0.86% |
| Immigrants | Afghanistan | 100.0 /100 | #7 | Exceptional 0.91% |
| Immigrants | Yemen | 100.0 /100 | #8 | Exceptional 0.91% |
| Immigrants | Fiji | 100.0 /100 | #9 | Exceptional 0.92% |
| Marshallese | 100.0 /100 | #10 | Exceptional 0.94% |
| Afghans | 100.0 /100 | #11 | Exceptional 0.94% |
| Immigrants | Grenada | 100.0 /100 | #12 | Exceptional 0.94% |
| Soviet Union | 100.0 /100 | #13 | Exceptional 0.95% |
| Yuman | 100.0 /100 | #14 | Exceptional 0.95% |
| Immigrants | Hong Kong | 100.0 /100 | #15 | Exceptional 0.95% |
| Immigrants | Israel | 100.0 /100 | #16 | Exceptional 0.96% |
| Immigrants | China | 100.0 /100 | #17 | Exceptional 0.96% |
| Immigrants | Barbados | 100.0 /100 | #18 | Exceptional 0.97% |
| Puget Sound Salish | 100.0 /100 | #19 | Exceptional 0.97% |
Demographics Similar to Immigrants from Latvia by Disability Age Under 5
In terms of disability age under 5, the demographic groups most similar to Immigrants from Latvia are Immigrants from Nigeria (1.2%, a difference of 0.0%), Immigrants from Ireland (1.2%, a difference of 0.020%), Crow (1.2%, a difference of 0.090%), Immigrants from Kenya (1.2%, a difference of 0.13%), and Comanche (1.2%, a difference of 0.22%).
| Demographics | Rating | Rank | Disability Age Under 5 |
| Immigrants | Argentina | 60.2 /100 | #167 | Good 1.2% |
| Sierra Leoneans | 59.1 /100 | #168 | Average 1.2% |
| Immigrants | Uruguay | 59.0 /100 | #169 | Average 1.2% |
| Immigrants | Jamaica | 58.8 /100 | #170 | Average 1.2% |
| Guamanians/Chamorros | 57.8 /100 | #171 | Average 1.2% |
| Crow | 51.0 /100 | #172 | Average 1.2% |
| Immigrants | Ireland | 50.3 /100 | #173 | Average 1.2% |
| Immigrants | Latvia | 50.0 /100 | #174 | Average 1.2% |
| Immigrants | Nigeria | 50.0 /100 | #175 | Average 1.2% |
| Immigrants | Kenya | 48.6 /100 | #176 | Average 1.2% |
| Comanche | 47.5 /100 | #177 | Average 1.2% |
| Venezuelans | 47.1 /100 | #178 | Average 1.2% |
| Immigrants | Bahamas | 45.2 /100 | #179 | Average 1.2% |
| Immigrants | Mexico | 44.4 /100 | #180 | Average 1.2% |
| Immigrants | Peru | 43.7 /100 | #181 | Average 1.2% |
| Macedonians | 43.7 /100 | #181 | Average 1.2% |