British vs Immigrants from Latvia Disability Age Under 5
COMPARE
British
Immigrants from Latvia
Disability Age Under 5
Disability Age Under 5 Comparison
British
Immigrants from Latvia
1.5%
DISABILITY AGE UNDER 5
0.0/ 100
METRIC RATING
280th/ 347
METRIC RANK
1.2%
DISABILITY AGE UNDER 5
50.0/ 100
METRIC RATING
174th/ 347
METRIC RANK
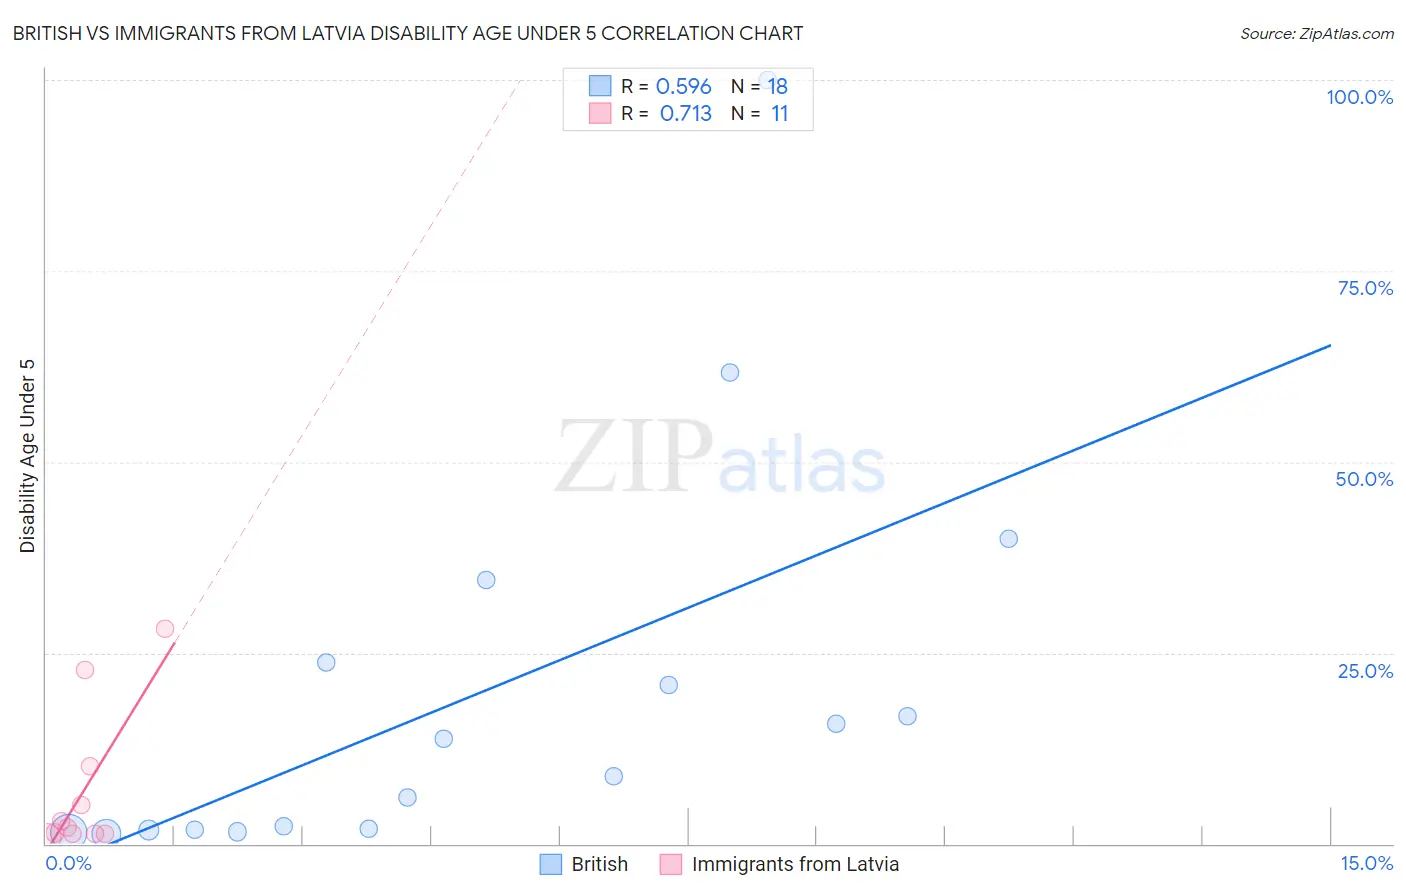
British vs Immigrants from Latvia Disability Age Under 5 Correlation Chart
The statistical analysis conducted on geographies consisting of 252,245,958 people shows a substantial positive correlation between the proportion of British and percentage of population with a disability under the age of 5 in the United States with a correlation coefficient (R) of 0.596 and weighted average of 1.5%. Similarly, the statistical analysis conducted on geographies consisting of 82,600,960 people shows a strong positive correlation between the proportion of Immigrants from Latvia and percentage of population with a disability under the age of 5 in the United States with a correlation coefficient (R) of 0.713 and weighted average of 1.2%, a difference of 19.9%.
Disability Age Under 5 Correlation Summary
| Measurement | British | Immigrants from Latvia |
| Minimum | 1.3% | 0.83% |
| Maximum | 100.0% | 28.2% |
| Range | 98.7% | 27.3% |
| Mean | 19.7% | 7.0% |
| Median | 11.3% | 2.1% |
| Interquartile 25% (IQ1) | 1.8% | 1.4% |
| Interquartile 75% (IQ3) | 23.7% | 10.1% |
| Interquartile Range (IQR) | 21.9% | 8.8% |
| Standard Deviation (Sample) | 26.0% | 9.6% |
| Standard Deviation (Population) | 25.3% | 9.1% |
Similar Demographics by Disability Age Under 5
Demographics Similar to British by Disability Age Under 5
In terms of disability age under 5, the demographic groups most similar to British are Danish (1.5%, a difference of 0.76%), Kiowa (1.5%, a difference of 0.77%), Canadian (1.5%, a difference of 0.85%), Greek (1.5%, a difference of 1.6%), and Czechoslovakian (1.5%, a difference of 1.7%).
| Demographics | Rating | Rank | Disability Age Under 5 |
| Alaskan Athabascans | 0.1 /100 | #273 | Tragic 1.5% |
| Iroquois | 0.0 /100 | #274 | Tragic 1.5% |
| Brazilians | 0.0 /100 | #275 | Tragic 1.5% |
| Greeks | 0.0 /100 | #276 | Tragic 1.5% |
| Canadians | 0.0 /100 | #277 | Tragic 1.5% |
| Kiowa | 0.0 /100 | #278 | Tragic 1.5% |
| Danes | 0.0 /100 | #279 | Tragic 1.5% |
| British | 0.0 /100 | #280 | Tragic 1.5% |
| Czechoslovakians | 0.0 /100 | #281 | Tragic 1.5% |
| Cheyenne | 0.0 /100 | #282 | Tragic 1.5% |
| Delaware | 0.0 /100 | #283 | Tragic 1.5% |
| Europeans | 0.0 /100 | #284 | Tragic 1.5% |
| Croatians | 0.0 /100 | #285 | Tragic 1.5% |
| Tlingit-Haida | 0.0 /100 | #286 | Tragic 1.5% |
| Scandinavians | 0.0 /100 | #287 | Tragic 1.5% |
Demographics Similar to Immigrants from Latvia by Disability Age Under 5
In terms of disability age under 5, the demographic groups most similar to Immigrants from Latvia are Immigrants from Nigeria (1.2%, a difference of 0.0%), Immigrants from Ireland (1.2%, a difference of 0.020%), Crow (1.2%, a difference of 0.090%), Immigrants from Kenya (1.2%, a difference of 0.13%), and Comanche (1.2%, a difference of 0.22%).
| Demographics | Rating | Rank | Disability Age Under 5 |
| Immigrants | Argentina | 60.2 /100 | #167 | Good 1.2% |
| Sierra Leoneans | 59.1 /100 | #168 | Average 1.2% |
| Immigrants | Uruguay | 59.0 /100 | #169 | Average 1.2% |
| Immigrants | Jamaica | 58.8 /100 | #170 | Average 1.2% |
| Guamanians/Chamorros | 57.8 /100 | #171 | Average 1.2% |
| Crow | 51.0 /100 | #172 | Average 1.2% |
| Immigrants | Ireland | 50.3 /100 | #173 | Average 1.2% |
| Immigrants | Latvia | 50.0 /100 | #174 | Average 1.2% |
| Immigrants | Nigeria | 50.0 /100 | #175 | Average 1.2% |
| Immigrants | Kenya | 48.6 /100 | #176 | Average 1.2% |
| Comanche | 47.5 /100 | #177 | Average 1.2% |
| Venezuelans | 47.1 /100 | #178 | Average 1.2% |
| Immigrants | Bahamas | 45.2 /100 | #179 | Average 1.2% |
| Immigrants | Mexico | 44.4 /100 | #180 | Average 1.2% |
| Immigrants | Peru | 43.7 /100 | #181 | Average 1.2% |
| Macedonians | 43.7 /100 | #181 | Average 1.2% |