Immigrants from Grenada vs Armenian Disability Age Under 5
COMPARE
Immigrants from Grenada
Armenian
Disability Age Under 5
Disability Age Under 5 Comparison
Immigrants from Grenada
Armenians
0.94%
DISABILITY AGE UNDER 5
100.0/ 100
METRIC RATING
12th/ 347
METRIC RANK
1.0%
DISABILITY AGE UNDER 5
99.9/ 100
METRIC RATING
31st/ 347
METRIC RANK
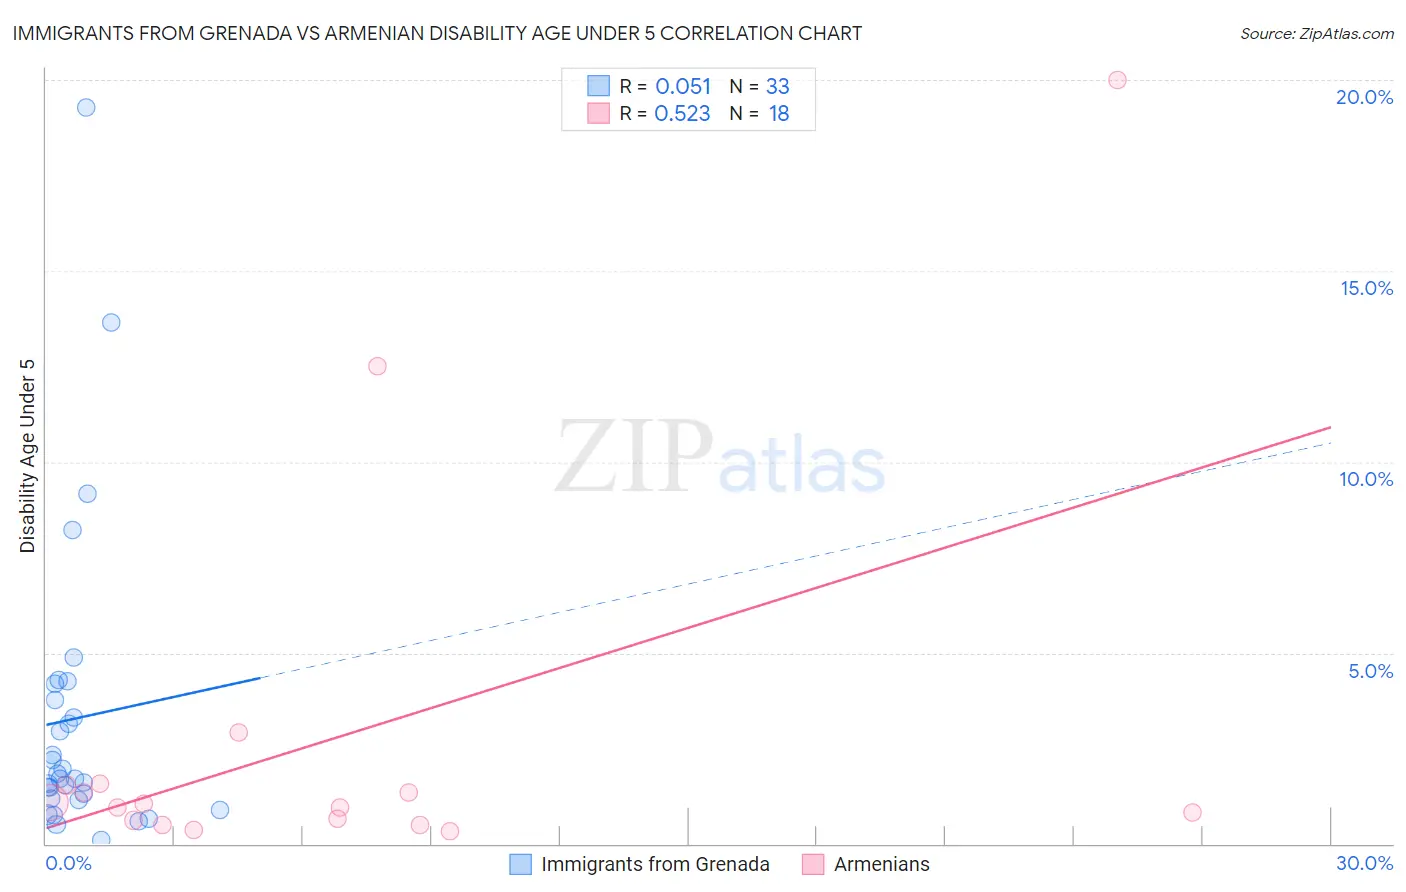
Immigrants from Grenada vs Armenian Disability Age Under 5 Correlation Chart
The statistical analysis conducted on geographies consisting of 49,697,157 people shows a slight positive correlation between the proportion of Immigrants from Grenada and percentage of population with a disability under the age of 5 in the United States with a correlation coefficient (R) of 0.051 and weighted average of 0.94%. Similarly, the statistical analysis conducted on geographies consisting of 178,674,366 people shows a substantial positive correlation between the proportion of Armenians and percentage of population with a disability under the age of 5 in the United States with a correlation coefficient (R) of 0.523 and weighted average of 1.0%, a difference of 9.2%.
Disability Age Under 5 Correlation Summary
| Measurement | Immigrants from Grenada | Armenian |
| Minimum | 0.086% | 0.31% |
| Maximum | 19.3% | 20.0% |
| Range | 19.2% | 19.7% |
| Mean | 3.3% | 2.7% |
| Median | 1.7% | 1.0% |
| Interquartile 25% (IQ1) | 1.1% | 0.61% |
| Interquartile 75% (IQ3) | 4.0% | 1.5% |
| Interquartile Range (IQR) | 2.8% | 0.92% |
| Standard Deviation (Sample) | 4.0% | 5.1% |
| Standard Deviation (Population) | 4.0% | 5.0% |
Demographics Similar to Immigrants from Grenada and Armenians by Disability Age Under 5
In terms of disability age under 5, the demographic groups most similar to Immigrants from Grenada are Afghan (0.94%, a difference of 0.020%), Soviet Union (0.95%, a difference of 0.17%), Yuman (0.95%, a difference of 0.24%), Immigrants from Hong Kong (0.95%, a difference of 0.28%), and Immigrants from Israel (0.96%, a difference of 1.5%). Similarly, the demographic groups most similar to Armenians are Immigrants from South Central Asia (1.0%, a difference of 0.28%), Immigrants from Belarus (1.0%, a difference of 0.81%), Immigrants from Eastern Asia (1.0%, a difference of 0.93%), Guyanese (1.0%, a difference of 1.6%), and Immigrants from Taiwan (1.0%, a difference of 2.4%).
| Demographics | Rating | Rank | Disability Age Under 5 |
| Afghans | 100.0 /100 | #11 | Exceptional 0.94% |
| Immigrants | Grenada | 100.0 /100 | #12 | Exceptional 0.94% |
| Soviet Union | 100.0 /100 | #13 | Exceptional 0.95% |
| Yuman | 100.0 /100 | #14 | Exceptional 0.95% |
| Immigrants | Hong Kong | 100.0 /100 | #15 | Exceptional 0.95% |
| Immigrants | Israel | 100.0 /100 | #16 | Exceptional 0.96% |
| Immigrants | China | 100.0 /100 | #17 | Exceptional 0.96% |
| Immigrants | Barbados | 100.0 /100 | #18 | Exceptional 0.97% |
| Puget Sound Salish | 100.0 /100 | #19 | Exceptional 0.97% |
| Nepalese | 100.0 /100 | #20 | Exceptional 0.97% |
| British West Indians | 100.0 /100 | #21 | Exceptional 0.99% |
| Immigrants | Iran | 100.0 /100 | #22 | Exceptional 1.00% |
| Yakama | 100.0 /100 | #23 | Exceptional 1.00% |
| Indians (Asian) | 100.0 /100 | #24 | Exceptional 1.0% |
| Immigrants | Micronesia | 100.0 /100 | #25 | Exceptional 1.0% |
| Immigrants | Taiwan | 100.0 /100 | #26 | Exceptional 1.0% |
| Guyanese | 100.0 /100 | #27 | Exceptional 1.0% |
| Immigrants | Eastern Asia | 100.0 /100 | #28 | Exceptional 1.0% |
| Immigrants | Belarus | 100.0 /100 | #29 | Exceptional 1.0% |
| Immigrants | South Central Asia | 99.9 /100 | #30 | Exceptional 1.0% |
| Armenians | 99.9 /100 | #31 | Exceptional 1.0% |