Dutch West Indian vs Asian Self-Care Disability
COMPARE
Dutch West Indian
Asian
Self-Care Disability
Self-Care Disability Comparison
Dutch West Indians
Asians
3.0%
SELF-CARE DISABILITY
0.0/ 100
METRIC RATING
333rd/ 347
METRIC RANK
2.3%
SELF-CARE DISABILITY
99.2/ 100
METRIC RATING
71st/ 347
METRIC RANK
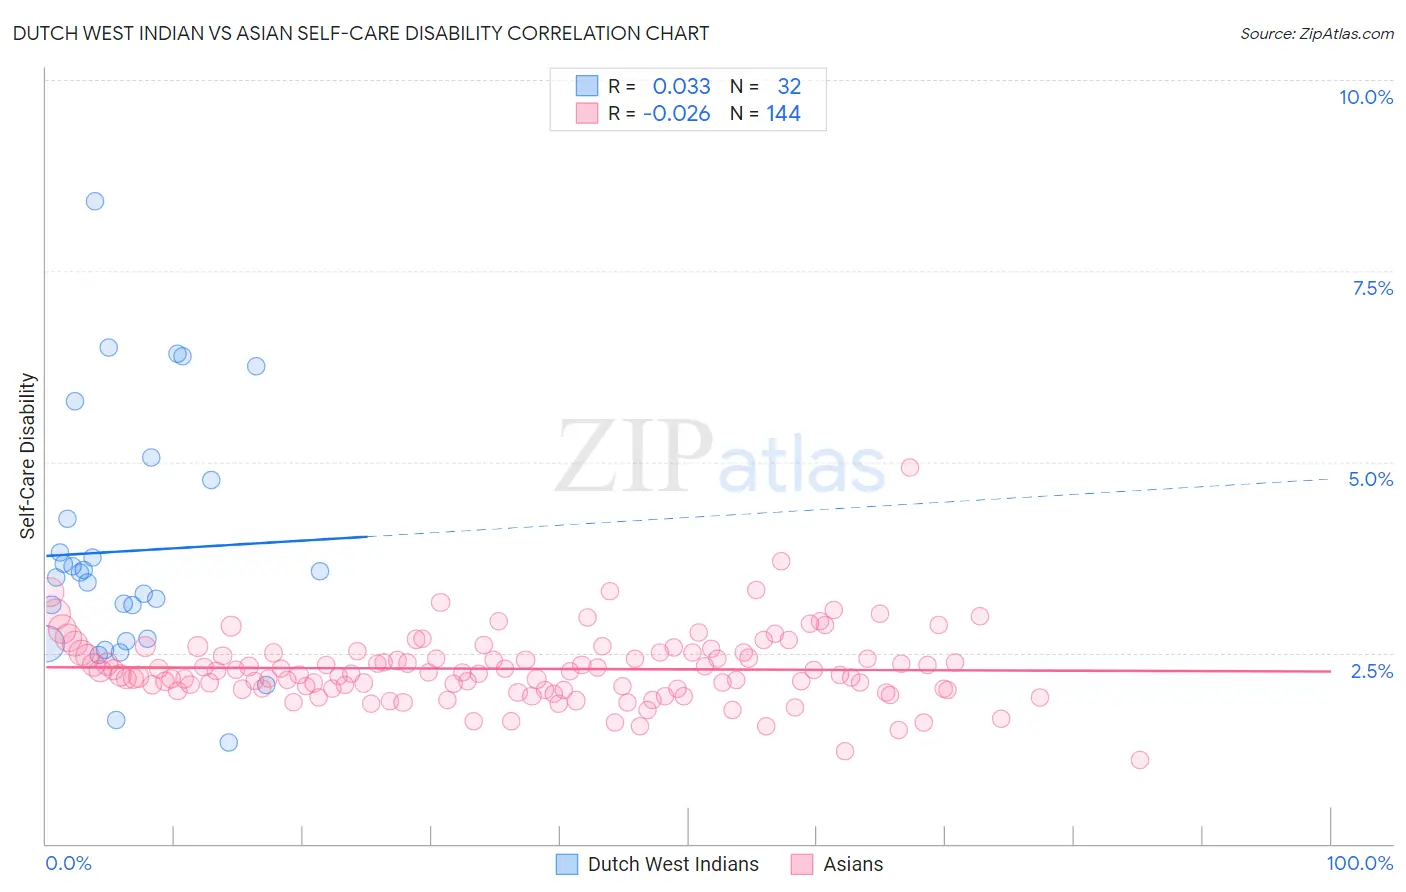
Dutch West Indian vs Asian Self-Care Disability Correlation Chart
The statistical analysis conducted on geographies consisting of 85,744,366 people shows no correlation between the proportion of Dutch West Indians and percentage of population with self-care disability in the United States with a correlation coefficient (R) of 0.033 and weighted average of 3.0%. Similarly, the statistical analysis conducted on geographies consisting of 549,189,639 people shows no correlation between the proportion of Asians and percentage of population with self-care disability in the United States with a correlation coefficient (R) of -0.026 and weighted average of 2.3%, a difference of 28.3%.
Self-Care Disability Correlation Summary
| Measurement | Dutch West Indian | Asian |
| Minimum | 1.3% | 1.1% |
| Maximum | 8.4% | 4.9% |
| Range | 7.1% | 3.8% |
| Mean | 3.8% | 2.3% |
| Median | 3.5% | 2.2% |
| Interquartile 25% (IQ1) | 2.7% | 2.0% |
| Interquartile 75% (IQ3) | 4.5% | 2.5% |
| Interquartile Range (IQR) | 1.8% | 0.47% |
| Standard Deviation (Sample) | 1.6% | 0.47% |
| Standard Deviation (Population) | 1.6% | 0.47% |
Similar Demographics by Self-Care Disability
Demographics Similar to Dutch West Indians by Self-Care Disability
In terms of self-care disability, the demographic groups most similar to Dutch West Indians are Houma (3.0%, a difference of 0.070%), Immigrants from the Azores (3.0%, a difference of 0.12%), Kiowa (3.0%, a difference of 0.23%), Immigrants from Yemen (3.0%, a difference of 0.28%), and Lumbee (3.0%, a difference of 0.59%).
| Demographics | Rating | Rank | Self-Care Disability |
| Paiute | 0.0 /100 | #326 | Tragic 2.9% |
| Blacks/African Americans | 0.0 /100 | #327 | Tragic 2.9% |
| Hopi | 0.0 /100 | #328 | Tragic 2.9% |
| Cajuns | 0.0 /100 | #329 | Tragic 2.9% |
| Nepalese | 0.0 /100 | #330 | Tragic 3.0% |
| Lumbee | 0.0 /100 | #331 | Tragic 3.0% |
| Kiowa | 0.0 /100 | #332 | Tragic 3.0% |
| Dutch West Indians | 0.0 /100 | #333 | Tragic 3.0% |
| Houma | 0.0 /100 | #334 | Tragic 3.0% |
| Immigrants | Azores | 0.0 /100 | #335 | Tragic 3.0% |
| Immigrants | Yemen | 0.0 /100 | #336 | Tragic 3.0% |
| Choctaw | 0.0 /100 | #337 | Tragic 3.0% |
| Cape Verdeans | 0.0 /100 | #338 | Tragic 3.0% |
| Immigrants | Dominican Republic | 0.0 /100 | #339 | Tragic 3.0% |
| Immigrants | Cabo Verde | 0.0 /100 | #340 | Tragic 3.1% |
Demographics Similar to Asians by Self-Care Disability
In terms of self-care disability, the demographic groups most similar to Asians are Eastern European (2.3%, a difference of 0.030%), Immigrants from Northern Europe (2.3%, a difference of 0.040%), Immigrants from Egypt (2.3%, a difference of 0.060%), Immigrants from Zaire (2.3%, a difference of 0.070%), and Immigrants from Norway (2.3%, a difference of 0.070%).
| Demographics | Rating | Rank | Self-Care Disability |
| Swedes | 99.3 /100 | #64 | Exceptional 2.3% |
| Brazilians | 99.3 /100 | #65 | Exceptional 2.3% |
| Immigrants | Argentina | 99.3 /100 | #66 | Exceptional 2.3% |
| South Africans | 99.3 /100 | #67 | Exceptional 2.3% |
| Immigrants | Zaire | 99.2 /100 | #68 | Exceptional 2.3% |
| Immigrants | Norway | 99.2 /100 | #69 | Exceptional 2.3% |
| Immigrants | Northern Europe | 99.2 /100 | #70 | Exceptional 2.3% |
| Asians | 99.2 /100 | #71 | Exceptional 2.3% |
| Eastern Europeans | 99.2 /100 | #72 | Exceptional 2.3% |
| Immigrants | Egypt | 99.1 /100 | #73 | Exceptional 2.3% |
| Immigrants | Switzerland | 99.1 /100 | #74 | Exceptional 2.3% |
| Immigrants | Netherlands | 99.1 /100 | #75 | Exceptional 2.3% |
| Immigrants | China | 99.1 /100 | #76 | Exceptional 2.3% |
| Immigrants | Middle Africa | 99.0 /100 | #77 | Exceptional 2.3% |
| Immigrants | Ireland | 99.0 /100 | #78 | Exceptional 2.3% |