Chickasaw vs Asian Self-Care Disability
COMPARE
Chickasaw
Asian
Self-Care Disability
Self-Care Disability Comparison
Chickasaw
Asians
2.9%
SELF-CARE DISABILITY
0.0/ 100
METRIC RATING
320th/ 347
METRIC RANK
2.3%
SELF-CARE DISABILITY
99.2/ 100
METRIC RATING
71st/ 347
METRIC RANK
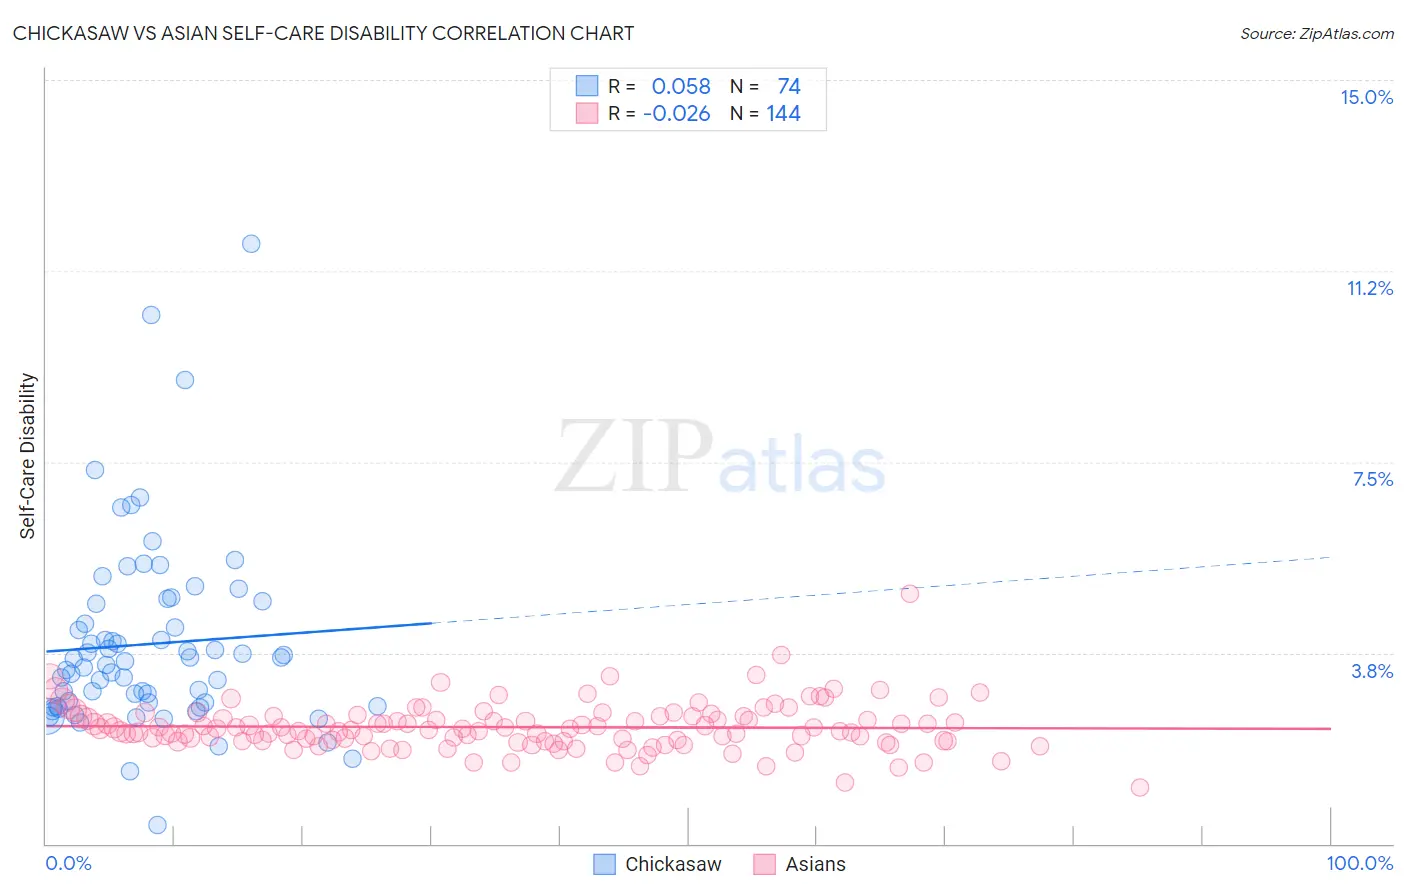
Chickasaw vs Asian Self-Care Disability Correlation Chart
The statistical analysis conducted on geographies consisting of 147,605,375 people shows a slight positive correlation between the proportion of Chickasaw and percentage of population with self-care disability in the United States with a correlation coefficient (R) of 0.058 and weighted average of 2.9%. Similarly, the statistical analysis conducted on geographies consisting of 549,189,639 people shows no correlation between the proportion of Asians and percentage of population with self-care disability in the United States with a correlation coefficient (R) of -0.026 and weighted average of 2.3%, a difference of 22.9%.
Self-Care Disability Correlation Summary
| Measurement | Chickasaw | Asian |
| Minimum | 0.38% | 1.1% |
| Maximum | 11.8% | 4.9% |
| Range | 11.4% | 3.8% |
| Mean | 3.9% | 2.3% |
| Median | 3.5% | 2.2% |
| Interquartile 25% (IQ1) | 2.7% | 2.0% |
| Interquartile 75% (IQ3) | 4.7% | 2.5% |
| Interquartile Range (IQR) | 2.0% | 0.47% |
| Standard Deviation (Sample) | 1.9% | 0.47% |
| Standard Deviation (Population) | 1.9% | 0.47% |
Similar Demographics by Self-Care Disability
Demographics Similar to Chickasaw by Self-Care Disability
In terms of self-care disability, the demographic groups most similar to Chickasaw are Navajo (2.9%, a difference of 0.15%), Spanish American Indian (2.9%, a difference of 0.22%), Assyrian/Chaldean/Syriac (2.8%, a difference of 0.37%), Immigrants from Dominica (2.8%, a difference of 0.38%), and Comanche (2.9%, a difference of 0.47%).
| Demographics | Rating | Rank | Self-Care Disability |
| Spanish Americans | 0.0 /100 | #313 | Tragic 2.8% |
| Creek | 0.0 /100 | #314 | Tragic 2.8% |
| Immigrants | Cuba | 0.0 /100 | #315 | Tragic 2.8% |
| Menominee | 0.0 /100 | #316 | Tragic 2.8% |
| Immigrants | Dominica | 0.0 /100 | #317 | Tragic 2.8% |
| Assyrians/Chaldeans/Syriacs | 0.0 /100 | #318 | Tragic 2.8% |
| Spanish American Indians | 0.0 /100 | #319 | Tragic 2.9% |
| Chickasaw | 0.0 /100 | #320 | Tragic 2.9% |
| Navajo | 0.0 /100 | #321 | Tragic 2.9% |
| Comanche | 0.0 /100 | #322 | Tragic 2.9% |
| Seminole | 0.0 /100 | #323 | Tragic 2.9% |
| Cherokee | 0.0 /100 | #324 | Tragic 2.9% |
| Immigrants | Uzbekistan | 0.0 /100 | #325 | Tragic 2.9% |
| Paiute | 0.0 /100 | #326 | Tragic 2.9% |
| Blacks/African Americans | 0.0 /100 | #327 | Tragic 2.9% |
Demographics Similar to Asians by Self-Care Disability
In terms of self-care disability, the demographic groups most similar to Asians are Eastern European (2.3%, a difference of 0.030%), Immigrants from Northern Europe (2.3%, a difference of 0.040%), Immigrants from Egypt (2.3%, a difference of 0.060%), Immigrants from Zaire (2.3%, a difference of 0.070%), and Immigrants from Norway (2.3%, a difference of 0.070%).
| Demographics | Rating | Rank | Self-Care Disability |
| Swedes | 99.3 /100 | #64 | Exceptional 2.3% |
| Brazilians | 99.3 /100 | #65 | Exceptional 2.3% |
| Immigrants | Argentina | 99.3 /100 | #66 | Exceptional 2.3% |
| South Africans | 99.3 /100 | #67 | Exceptional 2.3% |
| Immigrants | Zaire | 99.2 /100 | #68 | Exceptional 2.3% |
| Immigrants | Norway | 99.2 /100 | #69 | Exceptional 2.3% |
| Immigrants | Northern Europe | 99.2 /100 | #70 | Exceptional 2.3% |
| Asians | 99.2 /100 | #71 | Exceptional 2.3% |
| Eastern Europeans | 99.2 /100 | #72 | Exceptional 2.3% |
| Immigrants | Egypt | 99.1 /100 | #73 | Exceptional 2.3% |
| Immigrants | Switzerland | 99.1 /100 | #74 | Exceptional 2.3% |
| Immigrants | Netherlands | 99.1 /100 | #75 | Exceptional 2.3% |
| Immigrants | China | 99.1 /100 | #76 | Exceptional 2.3% |
| Immigrants | Middle Africa | 99.0 /100 | #77 | Exceptional 2.3% |
| Immigrants | Ireland | 99.0 /100 | #78 | Exceptional 2.3% |