Chickasaw vs Immigrants from Sudan Disability Age 5 to 17
COMPARE
Chickasaw
Immigrants from Sudan
Disability Age 5 to 17
Disability Age 5 to 17 Comparison
Chickasaw
Immigrants from Sudan
6.8%
DISABILITY AGE 5 TO 17
0.0/ 100
METRIC RATING
336th/ 347
METRIC RANK
5.8%
DISABILITY AGE 5 TO 17
6.7/ 100
METRIC RATING
222nd/ 347
METRIC RANK
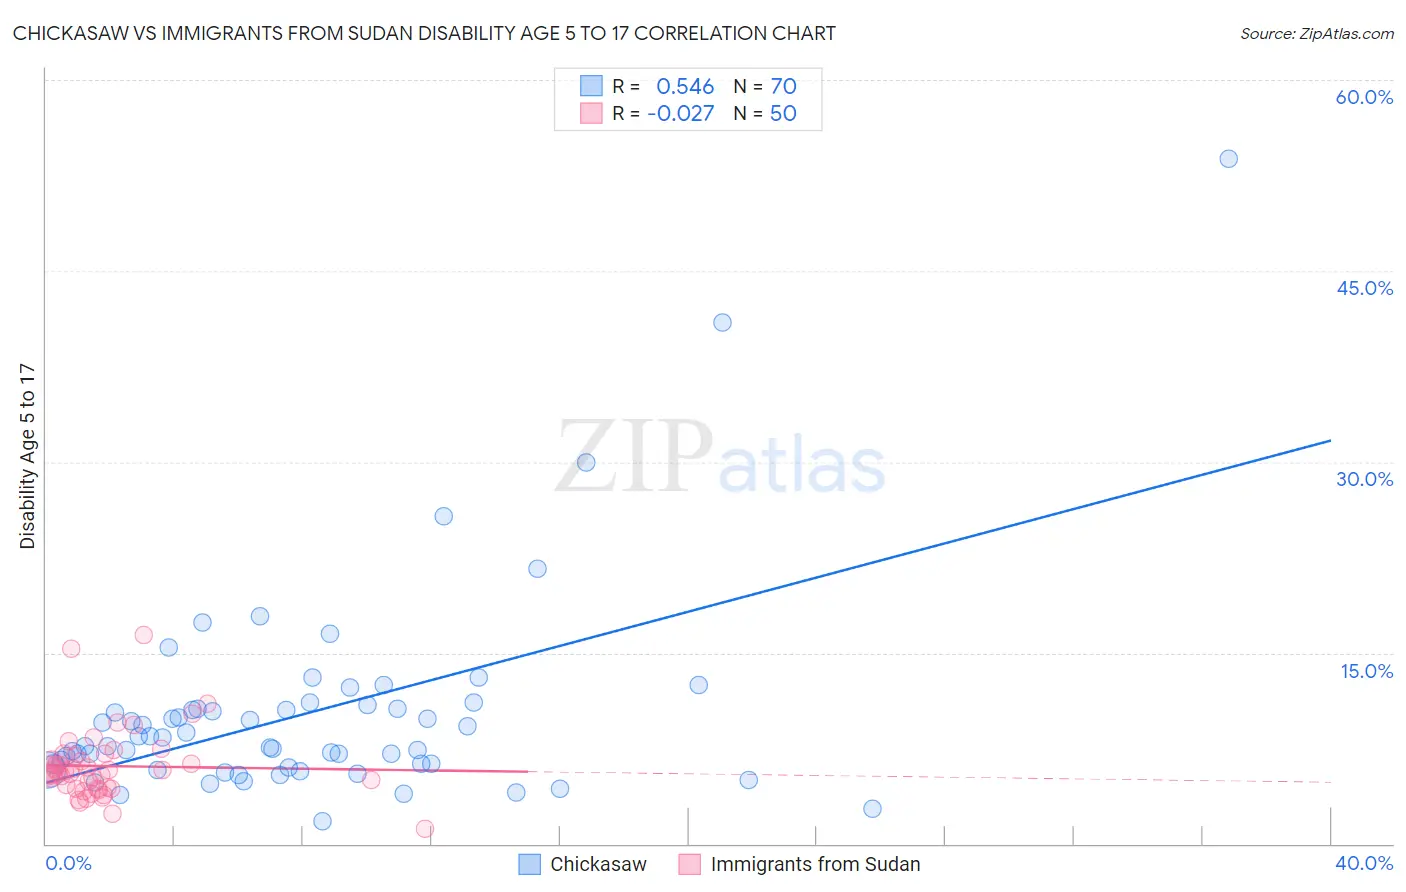
Chickasaw vs Immigrants from Sudan Disability Age 5 to 17 Correlation Chart
The statistical analysis conducted on geographies consisting of 147,149,878 people shows a substantial positive correlation between the proportion of Chickasaw and percentage of population with a disability between the ages 5 and 17 in the United States with a correlation coefficient (R) of 0.546 and weighted average of 6.8%. Similarly, the statistical analysis conducted on geographies consisting of 118,823,515 people shows no correlation between the proportion of Immigrants from Sudan and percentage of population with a disability between the ages 5 and 17 in the United States with a correlation coefficient (R) of -0.027 and weighted average of 5.8%, a difference of 18.3%.
Disability Age 5 to 17 Correlation Summary
| Measurement | Chickasaw | Immigrants from Sudan |
| Minimum | 1.8% | 1.2% |
| Maximum | 53.8% | 16.4% |
| Range | 52.1% | 15.2% |
| Mean | 10.2% | 6.1% |
| Median | 8.0% | 5.6% |
| Interquartile 25% (IQ1) | 6.0% | 4.3% |
| Interquartile 75% (IQ3) | 10.6% | 6.9% |
| Interquartile Range (IQR) | 4.7% | 2.6% |
| Standard Deviation (Sample) | 8.1% | 2.8% |
| Standard Deviation (Population) | 8.1% | 2.7% |
Similar Demographics by Disability Age 5 to 17
Demographics Similar to Chickasaw by Disability Age 5 to 17
In terms of disability age 5 to 17, the demographic groups most similar to Chickasaw are Creek (6.9%, a difference of 0.43%), Ottawa (6.8%, a difference of 0.50%), Iroquois (6.9%, a difference of 0.68%), Choctaw (6.9%, a difference of 1.0%), and Seminole (6.8%, a difference of 1.2%).
| Demographics | Rating | Rank | Disability Age 5 to 17 |
| Blackfeet | 0.0 /100 | #329 | Tragic 6.6% |
| Dutch West Indians | 0.0 /100 | #330 | Tragic 6.7% |
| French Canadians | 0.0 /100 | #331 | Tragic 6.7% |
| Immigrants | Azores | 0.0 /100 | #332 | Tragic 6.7% |
| Blacks/African Americans | 0.0 /100 | #333 | Tragic 6.8% |
| Seminole | 0.0 /100 | #334 | Tragic 6.8% |
| Ottawa | 0.0 /100 | #335 | Tragic 6.8% |
| Chickasaw | 0.0 /100 | #336 | Tragic 6.8% |
| Creek | 0.0 /100 | #337 | Tragic 6.9% |
| Iroquois | 0.0 /100 | #338 | Tragic 6.9% |
| Choctaw | 0.0 /100 | #339 | Tragic 6.9% |
| Cherokee | 0.0 /100 | #340 | Tragic 6.9% |
| Cape Verdeans | 0.0 /100 | #341 | Tragic 7.0% |
| Chippewa | 0.0 /100 | #342 | Tragic 7.1% |
| Immigrants | Cabo Verde | 0.0 /100 | #343 | Tragic 7.1% |
Demographics Similar to Immigrants from Sudan by Disability Age 5 to 17
In terms of disability age 5 to 17, the demographic groups most similar to Immigrants from Sudan are Lithuanian (5.8%, a difference of 0.0%), Belgian (5.8%, a difference of 0.040%), Sierra Leonean (5.8%, a difference of 0.060%), Immigrants from Sierra Leone (5.8%, a difference of 0.070%), and Czech (5.8%, a difference of 0.12%).
| Demographics | Rating | Rank | Disability Age 5 to 17 |
| Swedes | 8.1 /100 | #215 | Tragic 5.8% |
| Nigerians | 7.5 /100 | #216 | Tragic 5.8% |
| Czechs | 7.4 /100 | #217 | Tragic 5.8% |
| Immigrants | Sierra Leone | 7.1 /100 | #218 | Tragic 5.8% |
| Sierra Leoneans | 7.0 /100 | #219 | Tragic 5.8% |
| Belgians | 6.9 /100 | #220 | Tragic 5.8% |
| Lithuanians | 6.7 /100 | #221 | Tragic 5.8% |
| Immigrants | Sudan | 6.7 /100 | #222 | Tragic 5.8% |
| Alsatians | 6.0 /100 | #223 | Tragic 5.8% |
| Mexicans | 5.7 /100 | #224 | Tragic 5.8% |
| Guamanians/Chamorros | 5.6 /100 | #225 | Tragic 5.8% |
| British West Indians | 5.4 /100 | #226 | Tragic 5.8% |
| Swiss | 5.1 /100 | #227 | Tragic 5.8% |
| Haitians | 4.8 /100 | #228 | Tragic 5.8% |
| Bangladeshis | 4.8 /100 | #229 | Tragic 5.8% |