Immigrants from France vs Dutch West Indian Disability Age 5 to 17
COMPARE
Immigrants from France
Dutch West Indian
Disability Age 5 to 17
Disability Age 5 to 17 Comparison
Immigrants from France
Dutch West Indians
5.2%
DISABILITY AGE 5 TO 17
99.5/ 100
METRIC RATING
83rd/ 347
METRIC RANK
6.7%
DISABILITY AGE 5 TO 17
0.0/ 100
METRIC RATING
330th/ 347
METRIC RANK
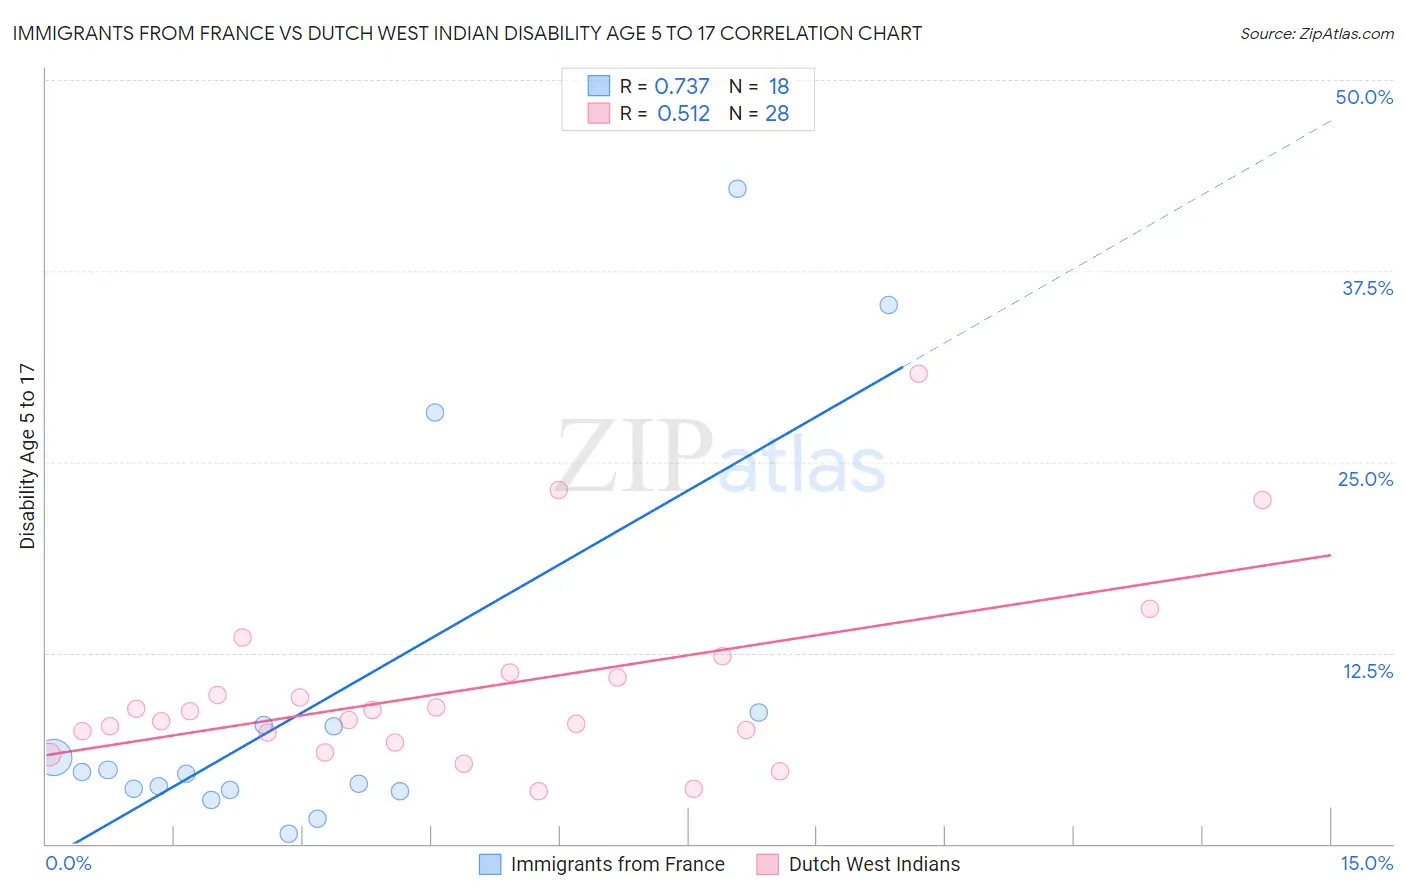
Immigrants from France vs Dutch West Indian Disability Age 5 to 17 Correlation Chart
The statistical analysis conducted on geographies consisting of 285,869,622 people shows a strong positive correlation between the proportion of Immigrants from France and percentage of population with a disability between the ages 5 and 17 in the United States with a correlation coefficient (R) of 0.737 and weighted average of 5.2%. Similarly, the statistical analysis conducted on geographies consisting of 85,576,125 people shows a substantial positive correlation between the proportion of Dutch West Indians and percentage of population with a disability between the ages 5 and 17 in the United States with a correlation coefficient (R) of 0.512 and weighted average of 6.7%, a difference of 28.1%.
Disability Age 5 to 17 Correlation Summary
| Measurement | Immigrants from France | Dutch West Indian |
| Minimum | 0.63% | 3.5% |
| Maximum | 42.9% | 30.8% |
| Range | 42.2% | 27.3% |
| Mean | 9.6% | 10.1% |
| Median | 4.7% | 8.4% |
| Interquartile 25% (IQ1) | 3.5% | 7.0% |
| Interquartile 75% (IQ3) | 7.8% | 11.0% |
| Interquartile Range (IQR) | 4.2% | 4.1% |
| Standard Deviation (Sample) | 12.3% | 6.2% |
| Standard Deviation (Population) | 12.0% | 6.1% |
Similar Demographics by Disability Age 5 to 17
Demographics Similar to Immigrants from France by Disability Age 5 to 17
In terms of disability age 5 to 17, the demographic groups most similar to Immigrants from France are Immigrants from Nicaragua (5.2%, a difference of 0.070%), Immigrants from Sweden (5.2%, a difference of 0.090%), Bulgarian (5.2%, a difference of 0.14%), Immigrants from St. Vincent and the Grenadines (5.2%, a difference of 0.18%), and Native Hawaiian (5.2%, a difference of 0.20%).
| Demographics | Rating | Rank | Disability Age 5 to 17 |
| Immigrants | Guyana | 99.6 /100 | #76 | Exceptional 5.2% |
| Immigrants | Kazakhstan | 99.6 /100 | #77 | Exceptional 5.2% |
| Immigrants | Cuba | 99.6 /100 | #78 | Exceptional 5.2% |
| Afghans | 99.6 /100 | #79 | Exceptional 5.2% |
| Sri Lankans | 99.6 /100 | #80 | Exceptional 5.2% |
| Native Hawaiians | 99.6 /100 | #81 | Exceptional 5.2% |
| Immigrants | Sweden | 99.5 /100 | #82 | Exceptional 5.2% |
| Immigrants | France | 99.5 /100 | #83 | Exceptional 5.2% |
| Immigrants | Nicaragua | 99.5 /100 | #84 | Exceptional 5.2% |
| Bulgarians | 99.4 /100 | #85 | Exceptional 5.2% |
| Immigrants | St. Vincent and the Grenadines | 99.4 /100 | #86 | Exceptional 5.2% |
| Eastern Europeans | 99.4 /100 | #87 | Exceptional 5.2% |
| Immigrants | Croatia | 99.4 /100 | #88 | Exceptional 5.2% |
| Immigrants | Spain | 99.4 /100 | #89 | Exceptional 5.2% |
| Immigrants | Kuwait | 99.4 /100 | #90 | Exceptional 5.3% |
Demographics Similar to Dutch West Indians by Disability Age 5 to 17
In terms of disability age 5 to 17, the demographic groups most similar to Dutch West Indians are French Canadian (6.7%, a difference of 0.080%), Immigrants from the Azores (6.7%, a difference of 0.10%), Black/African American (6.8%, a difference of 0.69%), Seminole (6.8%, a difference of 0.74%), and Ottawa (6.8%, a difference of 1.5%).
| Demographics | Rating | Rank | Disability Age 5 to 17 |
| Osage | 0.0 /100 | #323 | Tragic 6.5% |
| Dominicans | 0.0 /100 | #324 | Tragic 6.5% |
| Americans | 0.0 /100 | #325 | Tragic 6.5% |
| Potawatomi | 0.0 /100 | #326 | Tragic 6.5% |
| French American Indians | 0.0 /100 | #327 | Tragic 6.6% |
| Pennsylvania Germans | 0.0 /100 | #328 | Tragic 6.6% |
| Blackfeet | 0.0 /100 | #329 | Tragic 6.6% |
| Dutch West Indians | 0.0 /100 | #330 | Tragic 6.7% |
| French Canadians | 0.0 /100 | #331 | Tragic 6.7% |
| Immigrants | Azores | 0.0 /100 | #332 | Tragic 6.7% |
| Blacks/African Americans | 0.0 /100 | #333 | Tragic 6.8% |
| Seminole | 0.0 /100 | #334 | Tragic 6.8% |
| Ottawa | 0.0 /100 | #335 | Tragic 6.8% |
| Chickasaw | 0.0 /100 | #336 | Tragic 6.8% |
| Creek | 0.0 /100 | #337 | Tragic 6.9% |