Immigrants from France vs Peruvian Disability Age 5 to 17
COMPARE
Immigrants from France
Peruvian
Disability Age 5 to 17
Disability Age 5 to 17 Comparison
Immigrants from France
Peruvians
5.2%
DISABILITY AGE 5 TO 17
99.5/ 100
METRIC RATING
83rd/ 347
METRIC RANK
5.3%
DISABILITY AGE 5 TO 17
98.5/ 100
METRIC RATING
104th/ 347
METRIC RANK
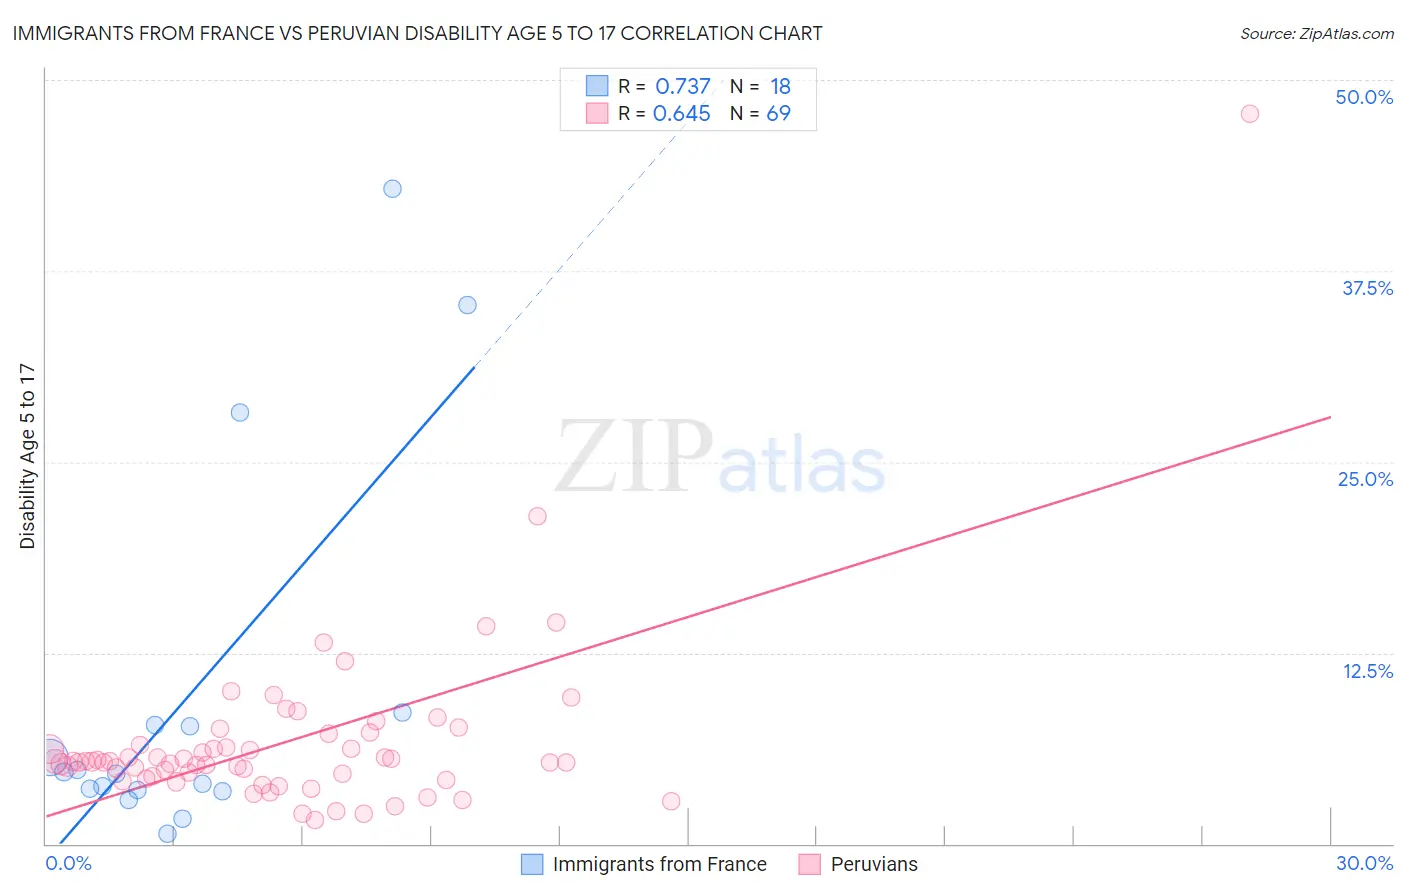
Immigrants from France vs Peruvian Disability Age 5 to 17 Correlation Chart
The statistical analysis conducted on geographies consisting of 285,869,622 people shows a strong positive correlation between the proportion of Immigrants from France and percentage of population with a disability between the ages 5 and 17 in the United States with a correlation coefficient (R) of 0.737 and weighted average of 5.2%. Similarly, the statistical analysis conducted on geographies consisting of 360,719,840 people shows a significant positive correlation between the proportion of Peruvians and percentage of population with a disability between the ages 5 and 17 in the United States with a correlation coefficient (R) of 0.645 and weighted average of 5.3%, a difference of 1.4%.
Disability Age 5 to 17 Correlation Summary
| Measurement | Immigrants from France | Peruvian |
| Minimum | 0.63% | 1.6% |
| Maximum | 42.9% | 47.8% |
| Range | 42.2% | 46.2% |
| Mean | 9.6% | 6.6% |
| Median | 4.7% | 5.4% |
| Interquartile 25% (IQ1) | 3.5% | 4.3% |
| Interquartile 75% (IQ3) | 7.8% | 6.8% |
| Interquartile Range (IQR) | 4.2% | 2.5% |
| Standard Deviation (Sample) | 12.3% | 6.0% |
| Standard Deviation (Population) | 12.0% | 5.9% |
Similar Demographics by Disability Age 5 to 17
Demographics Similar to Immigrants from France by Disability Age 5 to 17
In terms of disability age 5 to 17, the demographic groups most similar to Immigrants from France are Immigrants from Nicaragua (5.2%, a difference of 0.070%), Immigrants from Sweden (5.2%, a difference of 0.090%), Bulgarian (5.2%, a difference of 0.14%), Immigrants from St. Vincent and the Grenadines (5.2%, a difference of 0.18%), and Native Hawaiian (5.2%, a difference of 0.20%).
| Demographics | Rating | Rank | Disability Age 5 to 17 |
| Immigrants | Guyana | 99.6 /100 | #76 | Exceptional 5.2% |
| Immigrants | Kazakhstan | 99.6 /100 | #77 | Exceptional 5.2% |
| Immigrants | Cuba | 99.6 /100 | #78 | Exceptional 5.2% |
| Afghans | 99.6 /100 | #79 | Exceptional 5.2% |
| Sri Lankans | 99.6 /100 | #80 | Exceptional 5.2% |
| Native Hawaiians | 99.6 /100 | #81 | Exceptional 5.2% |
| Immigrants | Sweden | 99.5 /100 | #82 | Exceptional 5.2% |
| Immigrants | France | 99.5 /100 | #83 | Exceptional 5.2% |
| Immigrants | Nicaragua | 99.5 /100 | #84 | Exceptional 5.2% |
| Bulgarians | 99.4 /100 | #85 | Exceptional 5.2% |
| Immigrants | St. Vincent and the Grenadines | 99.4 /100 | #86 | Exceptional 5.2% |
| Eastern Europeans | 99.4 /100 | #87 | Exceptional 5.2% |
| Immigrants | Croatia | 99.4 /100 | #88 | Exceptional 5.2% |
| Immigrants | Spain | 99.4 /100 | #89 | Exceptional 5.2% |
| Immigrants | Kuwait | 99.4 /100 | #90 | Exceptional 5.3% |
Demographics Similar to Peruvians by Disability Age 5 to 17
In terms of disability age 5 to 17, the demographic groups most similar to Peruvians are Salvadoran (5.3%, a difference of 0.070%), Immigrants from Italy (5.3%, a difference of 0.090%), Nicaraguan (5.3%, a difference of 0.10%), Menominee (5.3%, a difference of 0.18%), and Nepalese (5.3%, a difference of 0.20%).
| Demographics | Rating | Rank | Disability Age 5 to 17 |
| Immigrants | Europe | 99.0 /100 | #97 | Exceptional 5.3% |
| Immigrants | Austria | 98.9 /100 | #98 | Exceptional 5.3% |
| Cambodians | 98.8 /100 | #99 | Exceptional 5.3% |
| Nepalese | 98.7 /100 | #100 | Exceptional 5.3% |
| Menominee | 98.7 /100 | #101 | Exceptional 5.3% |
| Nicaraguans | 98.6 /100 | #102 | Exceptional 5.3% |
| Salvadorans | 98.6 /100 | #103 | Exceptional 5.3% |
| Peruvians | 98.5 /100 | #104 | Exceptional 5.3% |
| Immigrants | Italy | 98.4 /100 | #105 | Exceptional 5.3% |
| Immigrants | Yemen | 98.2 /100 | #106 | Exceptional 5.3% |
| Russians | 98.2 /100 | #107 | Exceptional 5.3% |
| Immigrants | South Africa | 98.1 /100 | #108 | Exceptional 5.3% |
| Immigrants | Northern Africa | 98.1 /100 | #109 | Exceptional 5.3% |
| Immigrants | Eritrea | 98.0 /100 | #110 | Exceptional 5.3% |
| Ethiopians | 97.9 /100 | #111 | Exceptional 5.3% |