Immigrants from France vs Dutch West Indian Unemployment Among Women with Children Under 18 years
COMPARE
Immigrants from France
Dutch West Indian
Unemployment Among Women with Children Under 18 years
Unemployment Among Women with Children Under 18 years Comparison
Immigrants from France
Dutch West Indians
5.2%
UNEMPLOYMENT AMONG WOMEN WITH CHILDREN UNDER 18 YEARS
90.0/ 100
METRIC RATING
105th/ 347
METRIC RANK
6.2%
UNEMPLOYMENT AMONG WOMEN WITH CHILDREN UNDER 18 YEARS
0.0/ 100
METRIC RATING
275th/ 347
METRIC RANK
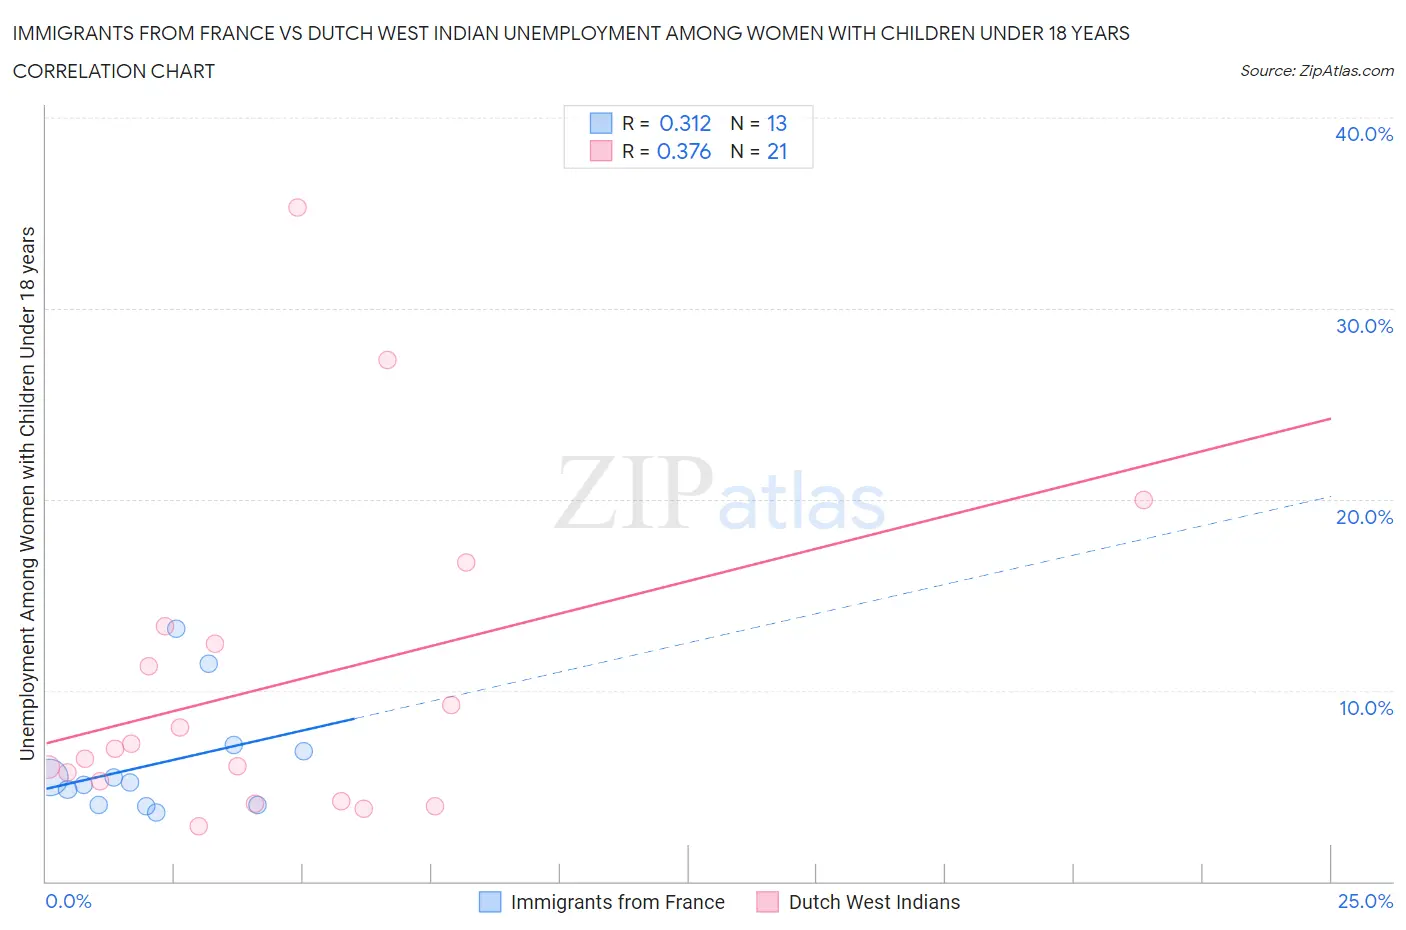
Immigrants from France vs Dutch West Indian Unemployment Among Women with Children Under 18 years Correlation Chart
The statistical analysis conducted on geographies consisting of 280,158,664 people shows a mild positive correlation between the proportion of Immigrants from France and unemployment rate among women with children under the age of 18 in the United States with a correlation coefficient (R) of 0.312 and weighted average of 5.2%. Similarly, the statistical analysis conducted on geographies consisting of 84,109,270 people shows a mild positive correlation between the proportion of Dutch West Indians and unemployment rate among women with children under the age of 18 in the United States with a correlation coefficient (R) of 0.376 and weighted average of 6.2%, a difference of 18.9%.
Unemployment Among Women with Children Under 18 years Correlation Summary
| Measurement | Immigrants from France | Dutch West Indian |
| Minimum | 3.6% | 2.9% |
| Maximum | 13.2% | 35.3% |
| Range | 9.6% | 32.4% |
| Mean | 6.1% | 10.3% |
| Median | 5.1% | 6.9% |
| Interquartile 25% (IQ1) | 4.0% | 4.7% |
| Interquartile 75% (IQ3) | 7.0% | 12.9% |
| Interquartile Range (IQR) | 3.0% | 8.1% |
| Standard Deviation (Sample) | 2.9% | 8.4% |
| Standard Deviation (Population) | 2.8% | 8.2% |
Similar Demographics by Unemployment Among Women with Children Under 18 years
Demographics Similar to Immigrants from France by Unemployment Among Women with Children Under 18 years
In terms of unemployment among women with children under 18 years, the demographic groups most similar to Immigrants from France are Immigrants from Switzerland (5.2%, a difference of 0.020%), Pakistani (5.2%, a difference of 0.020%), Slavic (5.2%, a difference of 0.030%), Sri Lankan (5.2%, a difference of 0.060%), and Iranian (5.2%, a difference of 0.070%).
| Demographics | Rating | Rank | Unemployment Among Women with Children Under 18 years |
| Immigrants | Vietnam | 92.0 /100 | #98 | Exceptional 5.2% |
| Cubans | 91.8 /100 | #99 | Exceptional 5.2% |
| Immigrants | Greece | 91.4 /100 | #100 | Exceptional 5.2% |
| Immigrants | Netherlands | 91.0 /100 | #101 | Exceptional 5.2% |
| Immigrants | Cuba | 90.9 /100 | #102 | Exceptional 5.2% |
| Sri Lankans | 90.3 /100 | #103 | Exceptional 5.2% |
| Immigrants | Switzerland | 90.1 /100 | #104 | Exceptional 5.2% |
| Immigrants | France | 90.0 /100 | #105 | Excellent 5.2% |
| Pakistanis | 89.9 /100 | #106 | Excellent 5.2% |
| Slavs | 89.8 /100 | #107 | Excellent 5.2% |
| Iranians | 89.7 /100 | #108 | Excellent 5.2% |
| Immigrants | Russia | 89.0 /100 | #109 | Excellent 5.2% |
| Immigrants | Czechoslovakia | 88.9 /100 | #110 | Excellent 5.2% |
| French Canadians | 88.9 /100 | #111 | Excellent 5.2% |
| Immigrants | Eastern Europe | 88.5 /100 | #112 | Excellent 5.2% |
Demographics Similar to Dutch West Indians by Unemployment Among Women with Children Under 18 years
In terms of unemployment among women with children under 18 years, the demographic groups most similar to Dutch West Indians are Immigrants from Ghana (6.2%, a difference of 0.11%), Mexican American Indian (6.2%, a difference of 0.12%), Immigrants from Barbados (6.2%, a difference of 0.13%), Senegalese (6.2%, a difference of 0.18%), and Immigrants from Western Africa (6.2%, a difference of 0.19%).
| Demographics | Rating | Rank | Unemployment Among Women with Children Under 18 years |
| Trinidadians and Tobagonians | 0.1 /100 | #268 | Tragic 6.2% |
| Cajuns | 0.1 /100 | #269 | Tragic 6.2% |
| Ghanaians | 0.1 /100 | #270 | Tragic 6.2% |
| Central Americans | 0.0 /100 | #271 | Tragic 6.2% |
| Salvadorans | 0.0 /100 | #272 | Tragic 6.2% |
| Immigrants | Western Africa | 0.0 /100 | #273 | Tragic 6.2% |
| Senegalese | 0.0 /100 | #274 | Tragic 6.2% |
| Dutch West Indians | 0.0 /100 | #275 | Tragic 6.2% |
| Immigrants | Ghana | 0.0 /100 | #276 | Tragic 6.2% |
| Mexican American Indians | 0.0 /100 | #277 | Tragic 6.2% |
| Immigrants | Barbados | 0.0 /100 | #278 | Tragic 6.2% |
| Immigrants | Portugal | 0.0 /100 | #279 | Tragic 6.3% |
| Guatemalans | 0.0 /100 | #280 | Tragic 6.3% |
| Immigrants | El Salvador | 0.0 /100 | #281 | Tragic 6.3% |
| Immigrants | St. Vincent and the Grenadines | 0.0 /100 | #282 | Tragic 6.3% |