Immigrants from Fiji vs Croatian Hearing Disability
COMPARE
Immigrants from Fiji
Croatian
Hearing Disability
Hearing Disability Comparison
Immigrants from Fiji
Croatians
2.9%
HEARING DISABILITY
67.1/ 100
METRIC RATING
160th/ 347
METRIC RANK
3.4%
HEARING DISABILITY
0.4/ 100
METRIC RATING
252nd/ 347
METRIC RANK
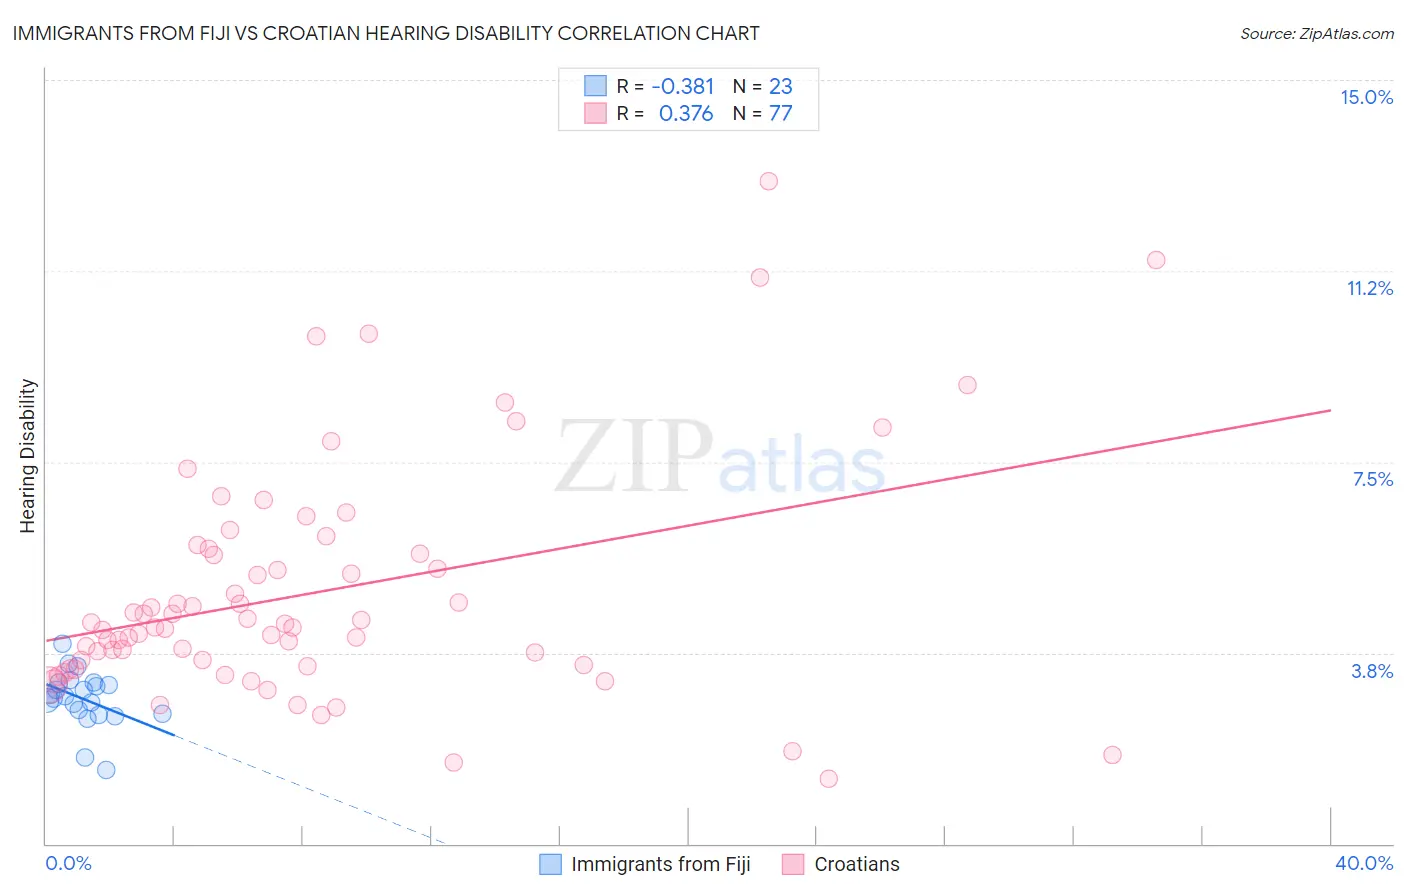
Immigrants from Fiji vs Croatian Hearing Disability Correlation Chart
The statistical analysis conducted on geographies consisting of 93,738,910 people shows a mild negative correlation between the proportion of Immigrants from Fiji and percentage of population with hearing disability in the United States with a correlation coefficient (R) of -0.381 and weighted average of 2.9%. Similarly, the statistical analysis conducted on geographies consisting of 375,644,002 people shows a mild positive correlation between the proportion of Croatians and percentage of population with hearing disability in the United States with a correlation coefficient (R) of 0.376 and weighted average of 3.4%, a difference of 15.2%.
Hearing Disability Correlation Summary
| Measurement | Immigrants from Fiji | Croatian |
| Minimum | 1.4% | 1.3% |
| Maximum | 3.9% | 13.0% |
| Range | 2.5% | 11.7% |
| Mean | 2.9% | 4.9% |
| Median | 2.9% | 4.3% |
| Interquartile 25% (IQ1) | 2.5% | 3.5% |
| Interquartile 75% (IQ3) | 3.2% | 5.8% |
| Interquartile Range (IQR) | 0.61% | 2.3% |
| Standard Deviation (Sample) | 0.54% | 2.3% |
| Standard Deviation (Population) | 0.53% | 2.3% |
Similar Demographics by Hearing Disability
Demographics Similar to Immigrants from Fiji by Hearing Disability
In terms of hearing disability, the demographic groups most similar to Immigrants from Fiji are Immigrants from Australia (2.9%, a difference of 0.020%), Albanian (2.9%, a difference of 0.060%), Immigrants from Japan (2.9%, a difference of 0.090%), Immigrants from Central America (3.0%, a difference of 0.24%), and Immigrants from Cambodia (3.0%, a difference of 0.25%).
| Demographics | Rating | Rank | Hearing Disability |
| Sudanese | 72.1 /100 | #153 | Good 2.9% |
| Immigrants | Lebanon | 71.5 /100 | #154 | Good 2.9% |
| Costa Ricans | 71.4 /100 | #155 | Good 2.9% |
| Immigrants | Poland | 70.2 /100 | #156 | Good 2.9% |
| Immigrants | Kazakhstan | 69.6 /100 | #157 | Good 2.9% |
| Immigrants | Burma/Myanmar | 69.5 /100 | #158 | Good 2.9% |
| Immigrants | Australia | 67.4 /100 | #159 | Good 2.9% |
| Immigrants | Fiji | 67.1 /100 | #160 | Good 2.9% |
| Albanians | 66.6 /100 | #161 | Good 2.9% |
| Immigrants | Japan | 66.3 /100 | #162 | Good 2.9% |
| Immigrants | Central America | 64.9 /100 | #163 | Good 3.0% |
| Immigrants | Cambodia | 64.8 /100 | #164 | Good 3.0% |
| Immigrants | Zimbabwe | 64.2 /100 | #165 | Good 3.0% |
| Immigrants | South Eastern Asia | 62.9 /100 | #166 | Good 3.0% |
| Immigrants | Eastern Europe | 58.1 /100 | #167 | Average 3.0% |
Demographics Similar to Croatians by Hearing Disability
In terms of hearing disability, the demographic groups most similar to Croatians are Hungarian (3.4%, a difference of 0.21%), Yuman (3.4%, a difference of 0.44%), Italian (3.4%, a difference of 0.45%), Carpatho Rusyn (3.4%, a difference of 0.45%), and Slavic (3.4%, a difference of 0.87%).
| Demographics | Rating | Rank | Hearing Disability |
| Immigrants | Scotland | 0.8 /100 | #245 | Tragic 3.3% |
| Immigrants | England | 0.7 /100 | #246 | Tragic 3.3% |
| Lithuanians | 0.6 /100 | #247 | Tragic 3.4% |
| Austrians | 0.6 /100 | #248 | Tragic 3.4% |
| Italians | 0.4 /100 | #249 | Tragic 3.4% |
| Yuman | 0.4 /100 | #250 | Tragic 3.4% |
| Hungarians | 0.4 /100 | #251 | Tragic 3.4% |
| Croatians | 0.4 /100 | #252 | Tragic 3.4% |
| Carpatho Rusyns | 0.3 /100 | #253 | Tragic 3.4% |
| Slavs | 0.2 /100 | #254 | Tragic 3.4% |
| Poles | 0.2 /100 | #255 | Tragic 3.4% |
| Hmong | 0.2 /100 | #256 | Tragic 3.4% |
| Yaqui | 0.2 /100 | #257 | Tragic 3.4% |
| Northern Europeans | 0.2 /100 | #258 | Tragic 3.4% |
| Slovenes | 0.1 /100 | #259 | Tragic 3.5% |