Immigrants from Fiji vs Scandinavian Female Unemployment
COMPARE
Immigrants from Fiji
Scandinavian
Female Unemployment
Female Unemployment Comparison
Immigrants from Fiji
Scandinavians
5.8%
FEMALE UNEMPLOYMENT
0.2/ 100
METRIC RATING
259th/ 347
METRIC RANK
4.6%
FEMALE UNEMPLOYMENT
100.0/ 100
METRIC RATING
11th/ 347
METRIC RANK
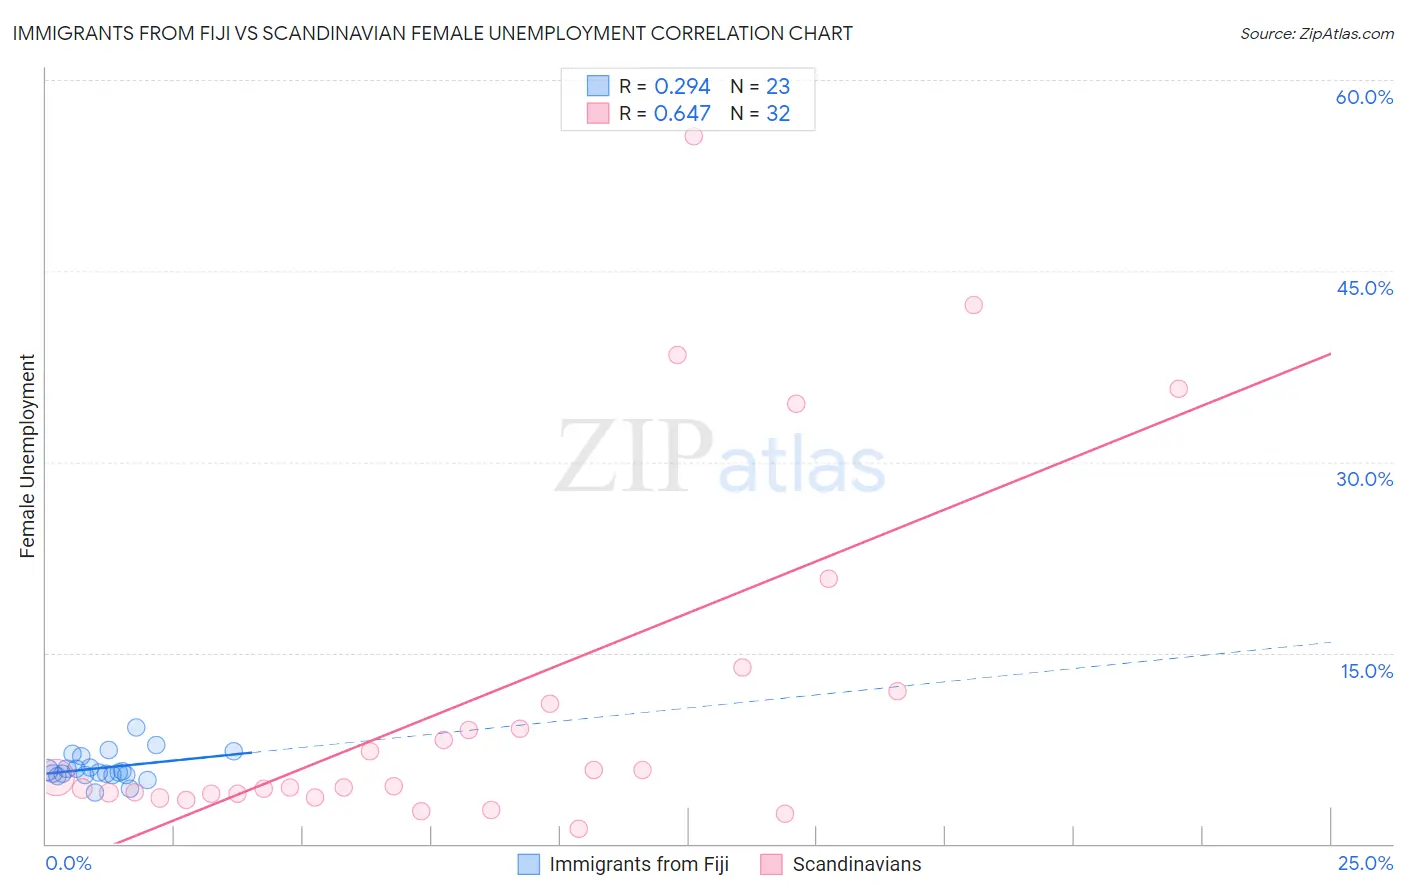
Immigrants from Fiji vs Scandinavian Female Unemployment Correlation Chart
The statistical analysis conducted on geographies consisting of 93,721,389 people shows a weak positive correlation between the proportion of Immigrants from Fiji and unemploymnet rate among females in the United States with a correlation coefficient (R) of 0.294 and weighted average of 5.8%. Similarly, the statistical analysis conducted on geographies consisting of 466,355,469 people shows a significant positive correlation between the proportion of Scandinavians and unemploymnet rate among females in the United States with a correlation coefficient (R) of 0.647 and weighted average of 4.6%, a difference of 26.1%.
Female Unemployment Correlation Summary
| Measurement | Immigrants from Fiji | Scandinavian |
| Minimum | 4.0% | 1.2% |
| Maximum | 9.1% | 55.6% |
| Range | 5.1% | 54.4% |
| Mean | 6.0% | 11.6% |
| Median | 5.6% | 4.9% |
| Interquartile 25% (IQ1) | 5.4% | 3.9% |
| Interquartile 75% (IQ3) | 6.8% | 11.5% |
| Interquartile Range (IQR) | 1.5% | 7.6% |
| Standard Deviation (Sample) | 1.1% | 13.9% |
| Standard Deviation (Population) | 1.1% | 13.7% |
Similar Demographics by Female Unemployment
Demographics Similar to Immigrants from Fiji by Female Unemployment
In terms of female unemployment, the demographic groups most similar to Immigrants from Fiji are Nigerian (5.8%, a difference of 0.040%), Immigrants from Portugal (5.8%, a difference of 0.11%), Kiowa (5.8%, a difference of 0.30%), Immigrants from Nigeria (5.8%, a difference of 0.33%), and Dutch West Indian (5.7%, a difference of 0.91%).
| Demographics | Rating | Rank | Female Unemployment |
| Cajuns | 0.7 /100 | #252 | Tragic 5.7% |
| Immigrants | Sierra Leone | 0.6 /100 | #253 | Tragic 5.7% |
| Immigrants | Immigrants | 0.6 /100 | #254 | Tragic 5.7% |
| Immigrants | Cameroon | 0.6 /100 | #255 | Tragic 5.7% |
| Sub-Saharan Africans | 0.4 /100 | #256 | Tragic 5.7% |
| Dutch West Indians | 0.3 /100 | #257 | Tragic 5.7% |
| Immigrants | Portugal | 0.2 /100 | #258 | Tragic 5.8% |
| Immigrants | Fiji | 0.2 /100 | #259 | Tragic 5.8% |
| Nigerians | 0.2 /100 | #260 | Tragic 5.8% |
| Kiowa | 0.1 /100 | #261 | Tragic 5.8% |
| Immigrants | Nigeria | 0.1 /100 | #262 | Tragic 5.8% |
| Immigrants | Azores | 0.1 /100 | #263 | Tragic 5.8% |
| Immigrants | Bahamas | 0.1 /100 | #264 | Tragic 5.8% |
| Blackfeet | 0.0 /100 | #265 | Tragic 5.9% |
| Cape Verdeans | 0.0 /100 | #266 | Tragic 5.9% |
Demographics Similar to Scandinavians by Female Unemployment
In terms of female unemployment, the demographic groups most similar to Scandinavians are Swiss (4.6%, a difference of 0.11%), Dutch (4.6%, a difference of 0.59%), Belgian (4.6%, a difference of 0.75%), Finnish (4.6%, a difference of 1.3%), and Slovene (4.5%, a difference of 1.4%).
| Demographics | Rating | Rank | Female Unemployment |
| Danes | 100.0 /100 | #4 | Exceptional 4.4% |
| Hmong | 100.0 /100 | #5 | Exceptional 4.4% |
| Swedes | 100.0 /100 | #6 | Exceptional 4.4% |
| Chinese | 100.0 /100 | #7 | Exceptional 4.5% |
| Germans | 100.0 /100 | #8 | Exceptional 4.5% |
| Slovenes | 100.0 /100 | #9 | Exceptional 4.5% |
| Swiss | 100.0 /100 | #10 | Exceptional 4.6% |
| Scandinavians | 100.0 /100 | #11 | Exceptional 4.6% |
| Dutch | 100.0 /100 | #12 | Exceptional 4.6% |
| Belgians | 100.0 /100 | #13 | Exceptional 4.6% |
| Finns | 100.0 /100 | #14 | Exceptional 4.6% |
| English | 100.0 /100 | #15 | Exceptional 4.6% |
| Carpatho Rusyns | 99.9 /100 | #16 | Exceptional 4.7% |
| Croatians | 99.9 /100 | #17 | Exceptional 4.7% |
| Latvians | 99.9 /100 | #18 | Exceptional 4.7% |