Immigrants from Fiji vs Pima Disability Age 5 to 17
COMPARE
Immigrants from Fiji
Pima
Disability Age 5 to 17
Disability Age 5 to 17 Comparison
Immigrants from Fiji
Pima
5.1%
DISABILITY AGE 5 TO 17
99.9/ 100
METRIC RATING
52nd/ 347
METRIC RANK
6.2%
DISABILITY AGE 5 TO 17
0.0/ 100
METRIC RATING
287th/ 347
METRIC RANK
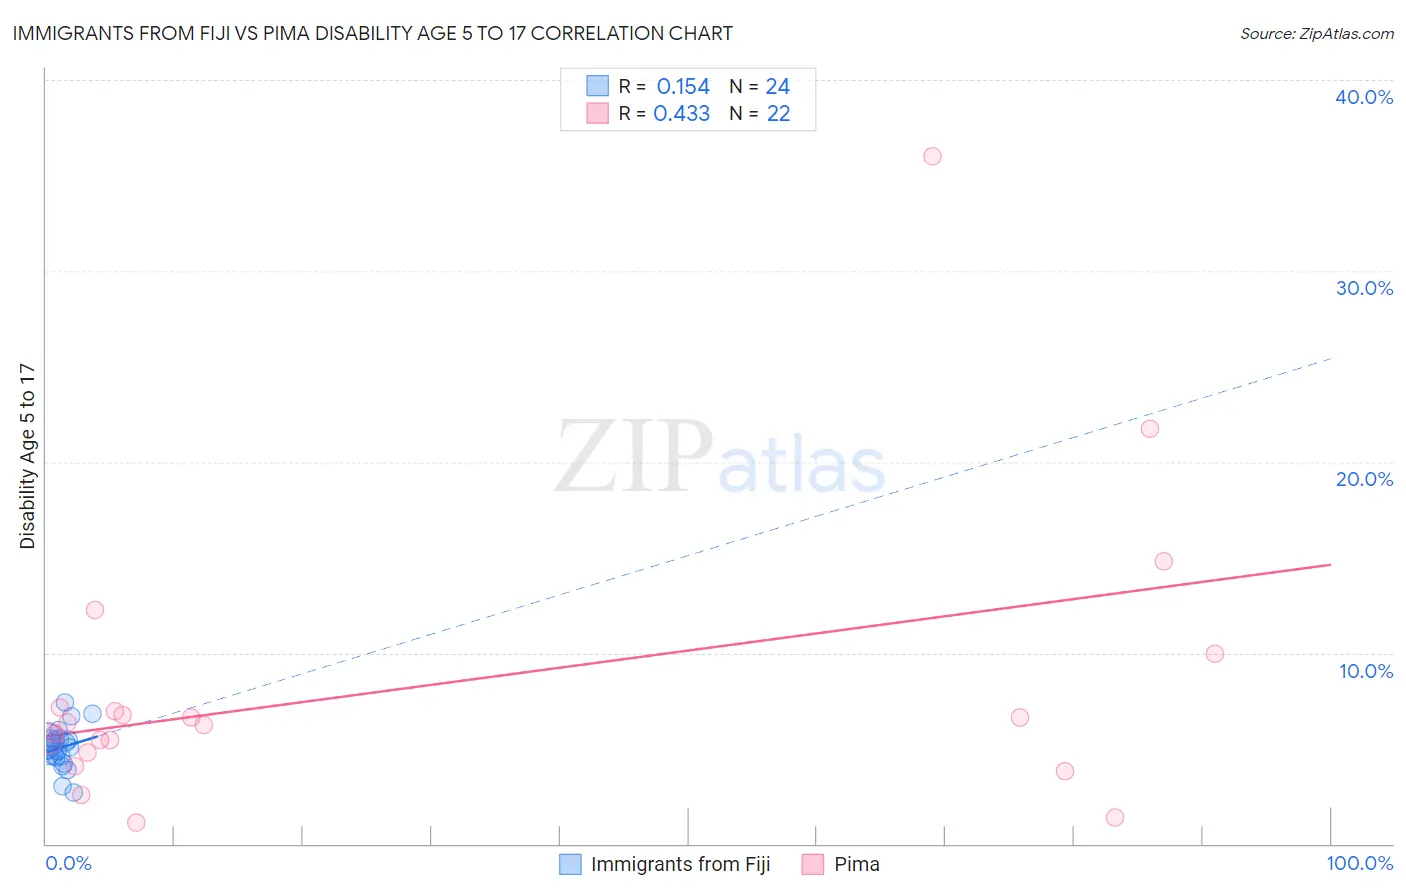
Immigrants from Fiji vs Pima Disability Age 5 to 17 Correlation Chart
The statistical analysis conducted on geographies consisting of 93,508,767 people shows a poor positive correlation between the proportion of Immigrants from Fiji and percentage of population with a disability between the ages 5 and 17 in the United States with a correlation coefficient (R) of 0.154 and weighted average of 5.1%. Similarly, the statistical analysis conducted on geographies consisting of 61,420,168 people shows a moderate positive correlation between the proportion of Pima and percentage of population with a disability between the ages 5 and 17 in the United States with a correlation coefficient (R) of 0.433 and weighted average of 6.2%, a difference of 20.9%.
Disability Age 5 to 17 Correlation Summary
| Measurement | Immigrants from Fiji | Pima |
| Minimum | 2.7% | 1.1% |
| Maximum | 7.4% | 36.0% |
| Range | 4.7% | 34.9% |
| Mean | 5.0% | 8.2% |
| Median | 5.0% | 6.3% |
| Interquartile 25% (IQ1) | 4.6% | 4.8% |
| Interquartile 75% (IQ3) | 5.5% | 7.1% |
| Interquartile Range (IQR) | 0.92% | 2.3% |
| Standard Deviation (Sample) | 1.1% | 7.7% |
| Standard Deviation (Population) | 1.1% | 7.5% |
Similar Demographics by Disability Age 5 to 17
Demographics Similar to Immigrants from Fiji by Disability Age 5 to 17
In terms of disability age 5 to 17, the demographic groups most similar to Immigrants from Fiji are Immigrants from Lithuania (5.1%, a difference of 0.050%), Paraguayan (5.1%, a difference of 0.080%), Turkish (5.1%, a difference of 0.090%), Laotian (5.1%, a difference of 0.13%), and Immigrants from Turkey (5.1%, a difference of 0.14%).
| Demographics | Rating | Rank | Disability Age 5 to 17 |
| Tongans | 100.0 /100 | #45 | Exceptional 5.0% |
| Assyrians/Chaldeans/Syriacs | 100.0 /100 | #46 | Exceptional 5.0% |
| Vietnamese | 100.0 /100 | #47 | Exceptional 5.1% |
| Koreans | 100.0 /100 | #48 | Exceptional 5.1% |
| Immigrants | Western Asia | 100.0 /100 | #49 | Exceptional 5.1% |
| Argentineans | 99.9 /100 | #50 | Exceptional 5.1% |
| Turks | 99.9 /100 | #51 | Exceptional 5.1% |
| Immigrants | Fiji | 99.9 /100 | #52 | Exceptional 5.1% |
| Immigrants | Lithuania | 99.9 /100 | #53 | Exceptional 5.1% |
| Paraguayans | 99.9 /100 | #54 | Exceptional 5.1% |
| Laotians | 99.9 /100 | #55 | Exceptional 5.1% |
| Immigrants | Turkey | 99.9 /100 | #56 | Exceptional 5.1% |
| Immigrants | Poland | 99.9 /100 | #57 | Exceptional 5.1% |
| Immigrants | Ukraine | 99.9 /100 | #58 | Exceptional 5.1% |
| Immigrants | North Macedonia | 99.9 /100 | #59 | Exceptional 5.1% |
Demographics Similar to Pima by Disability Age 5 to 17
In terms of disability age 5 to 17, the demographic groups most similar to Pima are Colville (6.2%, a difference of 0.19%), Subsaharan African (6.2%, a difference of 0.23%), English (6.2%, a difference of 0.23%), Ugandan (6.2%, a difference of 0.26%), and Jamaican (6.2%, a difference of 0.26%).
| Demographics | Rating | Rank | Disability Age 5 to 17 |
| Portuguese | 0.1 /100 | #280 | Tragic 6.1% |
| Scottish | 0.0 /100 | #281 | Tragic 6.1% |
| Germans | 0.0 /100 | #282 | Tragic 6.1% |
| Ugandans | 0.0 /100 | #283 | Tragic 6.2% |
| Sub-Saharan Africans | 0.0 /100 | #284 | Tragic 6.2% |
| English | 0.0 /100 | #285 | Tragic 6.2% |
| Colville | 0.0 /100 | #286 | Tragic 6.2% |
| Pima | 0.0 /100 | #287 | Tragic 6.2% |
| Jamaicans | 0.0 /100 | #288 | Tragic 6.2% |
| Yaqui | 0.0 /100 | #289 | Tragic 6.2% |
| Immigrants | Congo | 0.0 /100 | #290 | Tragic 6.2% |
| Whites/Caucasians | 0.0 /100 | #291 | Tragic 6.2% |
| Immigrants | Senegal | 0.0 /100 | #292 | Tragic 6.2% |
| Central American Indians | 0.0 /100 | #293 | Tragic 6.2% |
| Irish | 0.0 /100 | #294 | Tragic 6.2% |