Immigrants from Fiji vs Chilean Disability Age 5 to 17
COMPARE
Immigrants from Fiji
Chilean
Disability Age 5 to 17
Disability Age 5 to 17 Comparison
Immigrants from Fiji
Chileans
5.1%
DISABILITY AGE 5 TO 17
99.9/ 100
METRIC RATING
52nd/ 347
METRIC RANK
5.4%
DISABILITY AGE 5 TO 17
95.8/ 100
METRIC RATING
122nd/ 347
METRIC RANK
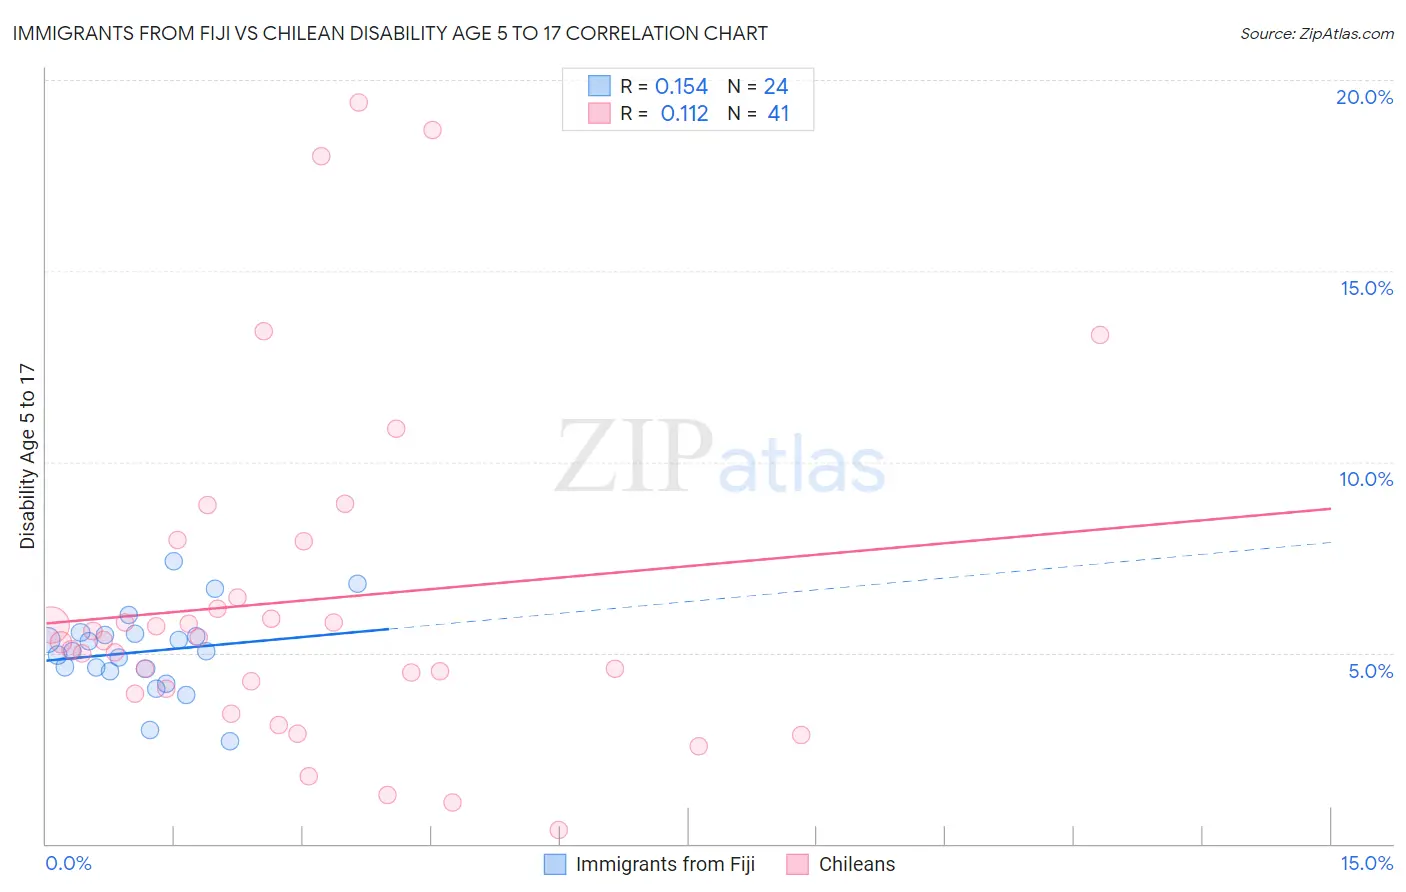
Immigrants from Fiji vs Chilean Disability Age 5 to 17 Correlation Chart
The statistical analysis conducted on geographies consisting of 93,508,767 people shows a poor positive correlation between the proportion of Immigrants from Fiji and percentage of population with a disability between the ages 5 and 17 in the United States with a correlation coefficient (R) of 0.154 and weighted average of 5.1%. Similarly, the statistical analysis conducted on geographies consisting of 255,519,515 people shows a poor positive correlation between the proportion of Chileans and percentage of population with a disability between the ages 5 and 17 in the United States with a correlation coefficient (R) of 0.112 and weighted average of 5.4%, a difference of 5.4%.
Disability Age 5 to 17 Correlation Summary
| Measurement | Immigrants from Fiji | Chilean |
| Minimum | 2.7% | 0.37% |
| Maximum | 7.4% | 19.4% |
| Range | 4.7% | 19.1% |
| Mean | 5.0% | 6.4% |
| Median | 5.0% | 5.3% |
| Interquartile 25% (IQ1) | 4.6% | 4.0% |
| Interquartile 75% (IQ3) | 5.5% | 7.2% |
| Interquartile Range (IQR) | 0.92% | 3.2% |
| Standard Deviation (Sample) | 1.1% | 4.5% |
| Standard Deviation (Population) | 1.1% | 4.4% |
Similar Demographics by Disability Age 5 to 17
Demographics Similar to Immigrants from Fiji by Disability Age 5 to 17
In terms of disability age 5 to 17, the demographic groups most similar to Immigrants from Fiji are Immigrants from Lithuania (5.1%, a difference of 0.050%), Paraguayan (5.1%, a difference of 0.080%), Turkish (5.1%, a difference of 0.090%), Laotian (5.1%, a difference of 0.13%), and Immigrants from Turkey (5.1%, a difference of 0.14%).
| Demographics | Rating | Rank | Disability Age 5 to 17 |
| Tongans | 100.0 /100 | #45 | Exceptional 5.0% |
| Assyrians/Chaldeans/Syriacs | 100.0 /100 | #46 | Exceptional 5.0% |
| Vietnamese | 100.0 /100 | #47 | Exceptional 5.1% |
| Koreans | 100.0 /100 | #48 | Exceptional 5.1% |
| Immigrants | Western Asia | 100.0 /100 | #49 | Exceptional 5.1% |
| Argentineans | 99.9 /100 | #50 | Exceptional 5.1% |
| Turks | 99.9 /100 | #51 | Exceptional 5.1% |
| Immigrants | Fiji | 99.9 /100 | #52 | Exceptional 5.1% |
| Immigrants | Lithuania | 99.9 /100 | #53 | Exceptional 5.1% |
| Paraguayans | 99.9 /100 | #54 | Exceptional 5.1% |
| Laotians | 99.9 /100 | #55 | Exceptional 5.1% |
| Immigrants | Turkey | 99.9 /100 | #56 | Exceptional 5.1% |
| Immigrants | Poland | 99.9 /100 | #57 | Exceptional 5.1% |
| Immigrants | Ukraine | 99.9 /100 | #58 | Exceptional 5.1% |
| Immigrants | North Macedonia | 99.9 /100 | #59 | Exceptional 5.1% |
Demographics Similar to Chileans by Disability Age 5 to 17
In terms of disability age 5 to 17, the demographic groups most similar to Chileans are Maltese (5.4%, a difference of 0.060%), Immigrants from Ethiopia (5.4%, a difference of 0.10%), Crow (5.4%, a difference of 0.23%), Immigrants from Chile (5.4%, a difference of 0.24%), and New Zealander (5.4%, a difference of 0.25%).
| Demographics | Rating | Rank | Disability Age 5 to 17 |
| Cubans | 97.8 /100 | #115 | Exceptional 5.3% |
| Cypriots | 97.7 /100 | #116 | Exceptional 5.3% |
| Immigrants | Afghanistan | 97.4 /100 | #117 | Exceptional 5.3% |
| South Americans | 97.1 /100 | #118 | Exceptional 5.4% |
| Immigrants | South America | 97.1 /100 | #119 | Exceptional 5.4% |
| Immigrants | Immigrants | 97.0 /100 | #120 | Exceptional 5.4% |
| Maltese | 96.0 /100 | #121 | Exceptional 5.4% |
| Chileans | 95.8 /100 | #122 | Exceptional 5.4% |
| Immigrants | Ethiopia | 95.5 /100 | #123 | Exceptional 5.4% |
| Crow | 95.0 /100 | #124 | Exceptional 5.4% |
| Immigrants | Chile | 95.0 /100 | #125 | Exceptional 5.4% |
| New Zealanders | 95.0 /100 | #126 | Exceptional 5.4% |
| Latvians | 95.0 /100 | #127 | Exceptional 5.4% |
| Immigrants | Venezuela | 94.5 /100 | #128 | Exceptional 5.4% |
| Romanians | 94.1 /100 | #129 | Exceptional 5.4% |