Immigrants from Europe vs Immigrants from Congo Self-Care Disability
COMPARE
Immigrants from Europe
Immigrants from Congo
Self-Care Disability
Self-Care Disability Comparison
Immigrants from Europe
Immigrants from Congo
2.4%
SELF-CARE DISABILITY
69.6/ 100
METRIC RATING
157th/ 347
METRIC RANK
2.4%
SELF-CARE DISABILITY
98.0/ 100
METRIC RATING
89th/ 347
METRIC RANK
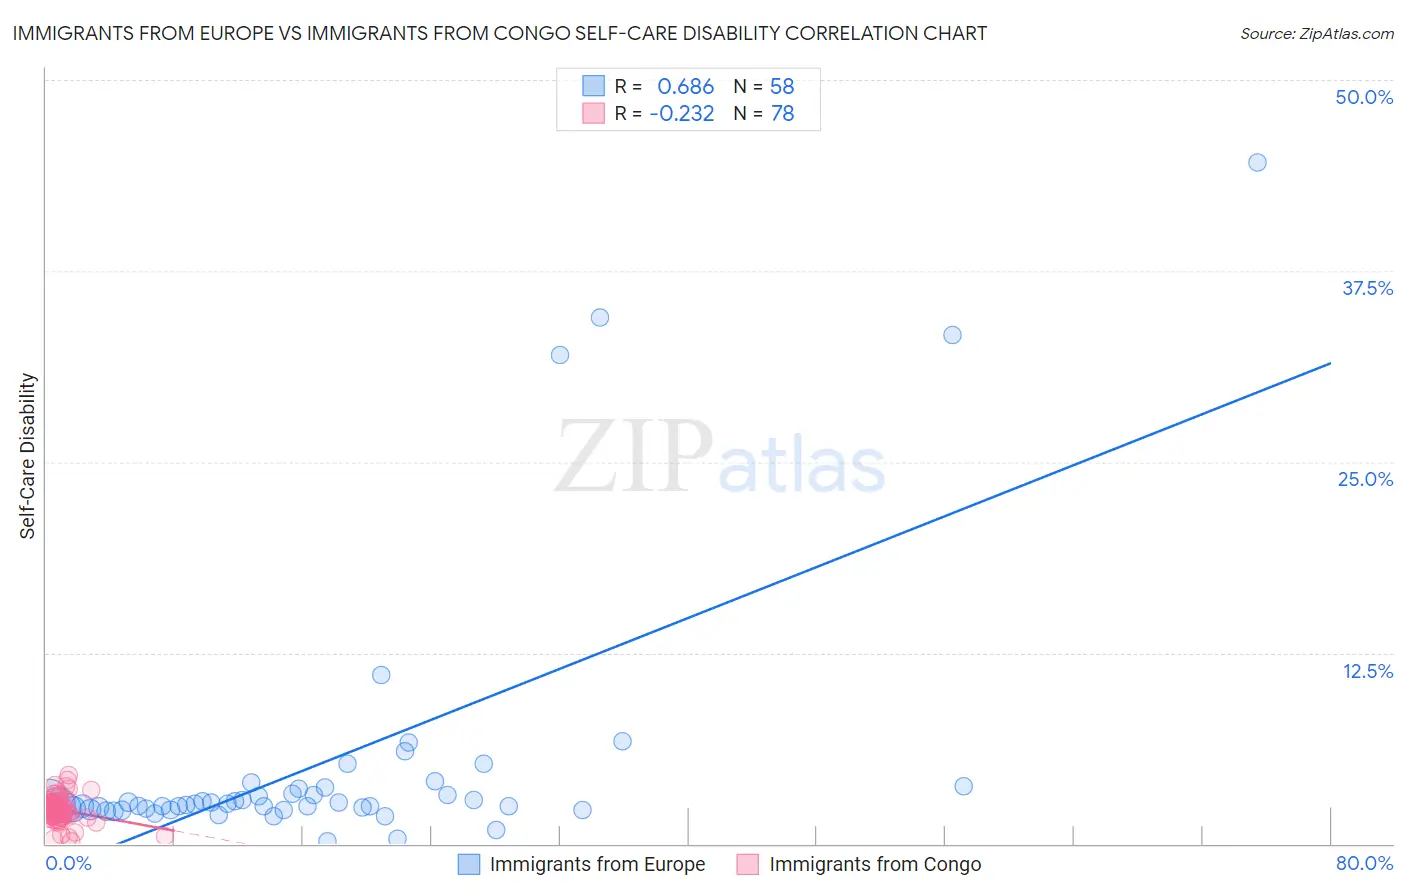
Immigrants from Europe vs Immigrants from Congo Self-Care Disability Correlation Chart
The statistical analysis conducted on geographies consisting of 545,734,078 people shows a significant positive correlation between the proportion of Immigrants from Europe and percentage of population with self-care disability in the United States with a correlation coefficient (R) of 0.686 and weighted average of 2.4%. Similarly, the statistical analysis conducted on geographies consisting of 92,100,672 people shows a weak negative correlation between the proportion of Immigrants from Congo and percentage of population with self-care disability in the United States with a correlation coefficient (R) of -0.232 and weighted average of 2.4%, a difference of 3.8%.
Self-Care Disability Correlation Summary
| Measurement | Immigrants from Europe | Immigrants from Congo |
| Minimum | 0.20% | 0.17% |
| Maximum | 44.6% | 4.5% |
| Range | 44.4% | 4.4% |
| Mean | 5.3% | 2.2% |
| Median | 2.6% | 2.3% |
| Interquartile 25% (IQ1) | 2.3% | 1.8% |
| Interquartile 75% (IQ3) | 3.6% | 2.6% |
| Interquartile Range (IQR) | 1.3% | 0.76% |
| Standard Deviation (Sample) | 8.7% | 0.81% |
| Standard Deviation (Population) | 8.6% | 0.80% |
Similar Demographics by Self-Care Disability
Demographics Similar to Immigrants from Europe by Self-Care Disability
In terms of self-care disability, the demographic groups most similar to Immigrants from Europe are Nigerian (2.4%, a difference of 0.060%), Immigrants from Western Europe (2.4%, a difference of 0.060%), Immigrants from Italy (2.4%, a difference of 0.060%), Pakistani (2.4%, a difference of 0.11%), and Finnish (2.4%, a difference of 0.14%).
| Demographics | Rating | Rank | Self-Care Disability |
| Immigrants | Costa Rica | 75.1 /100 | #150 | Good 2.4% |
| Basques | 74.0 /100 | #151 | Good 2.4% |
| Tlingit-Haida | 73.5 /100 | #152 | Good 2.4% |
| Immigrants | England | 73.5 /100 | #153 | Good 2.4% |
| Italians | 72.2 /100 | #154 | Good 2.4% |
| Pakistanis | 71.4 /100 | #155 | Good 2.4% |
| Nigerians | 70.6 /100 | #156 | Good 2.4% |
| Immigrants | Europe | 69.6 /100 | #157 | Good 2.4% |
| Immigrants | Western Europe | 68.6 /100 | #158 | Good 2.4% |
| Immigrants | Italy | 68.5 /100 | #159 | Good 2.4% |
| Finns | 67.0 /100 | #160 | Good 2.4% |
| Lebanese | 66.5 /100 | #161 | Good 2.4% |
| Somalis | 63.7 /100 | #162 | Good 2.5% |
| German Russians | 62.7 /100 | #163 | Good 2.5% |
| Immigrants | Vietnam | 59.3 /100 | #164 | Average 2.5% |
Demographics Similar to Immigrants from Congo by Self-Care Disability
In terms of self-care disability, the demographic groups most similar to Immigrants from Congo are Sierra Leonean (2.4%, a difference of 0.050%), Lithuanian (2.4%, a difference of 0.050%), Immigrants from Czechoslovakia (2.4%, a difference of 0.14%), Immigrants from Jordan (2.4%, a difference of 0.15%), and Immigrants from Northern Africa (2.3%, a difference of 0.19%).
| Demographics | Rating | Rank | Self-Care Disability |
| Immigrants | Denmark | 98.8 /100 | #82 | Exceptional 2.3% |
| Indians (Asian) | 98.7 /100 | #83 | Exceptional 2.3% |
| Immigrants | Spain | 98.7 /100 | #84 | Exceptional 2.3% |
| Estonians | 98.3 /100 | #85 | Exceptional 2.3% |
| Immigrants | Northern Africa | 98.2 /100 | #86 | Exceptional 2.3% |
| Sierra Leoneans | 98.0 /100 | #87 | Exceptional 2.4% |
| Lithuanians | 98.0 /100 | #88 | Exceptional 2.4% |
| Immigrants | Congo | 98.0 /100 | #89 | Exceptional 2.4% |
| Immigrants | Czechoslovakia | 97.7 /100 | #90 | Exceptional 2.4% |
| Immigrants | Jordan | 97.7 /100 | #91 | Exceptional 2.4% |
| Icelanders | 97.4 /100 | #92 | Exceptional 2.4% |
| Immigrants | Latvia | 97.0 /100 | #93 | Exceptional 2.4% |
| Macedonians | 96.9 /100 | #94 | Exceptional 2.4% |
| Immigrants | Asia | 96.9 /100 | #95 | Exceptional 2.4% |
| Immigrants | Chile | 96.7 /100 | #96 | Exceptional 2.4% |