Immigrants from Europe vs Immigrants from Congo Family Households
COMPARE
Immigrants from Europe
Immigrants from Congo
Family Households
Family Households Comparison
Immigrants from Europe
Immigrants from Congo
63.7%
FAMILY HOUSEHOLDS
6.4/ 100
METRIC RATING
220th/ 347
METRIC RANK
59.2%
FAMILY HOUSEHOLDS
0.0/ 100
METRIC RATING
344th/ 347
METRIC RANK
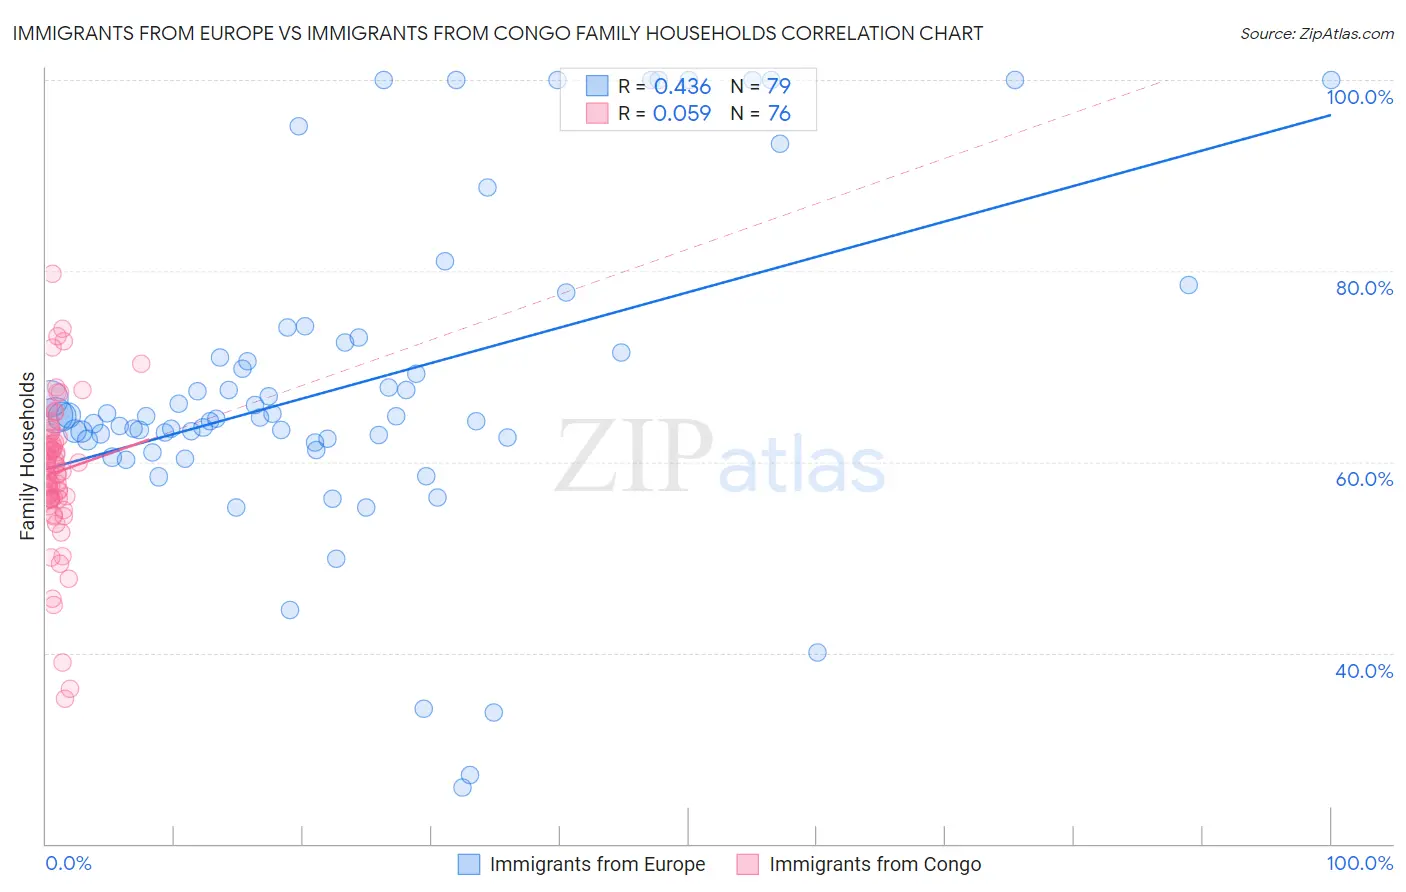
Immigrants from Europe vs Immigrants from Congo Family Households Correlation Chart
The statistical analysis conducted on geographies consisting of 546,902,993 people shows a moderate positive correlation between the proportion of Immigrants from Europe and percentage of family households in the United States with a correlation coefficient (R) of 0.436 and weighted average of 63.7%. Similarly, the statistical analysis conducted on geographies consisting of 92,089,117 people shows a slight positive correlation between the proportion of Immigrants from Congo and percentage of family households in the United States with a correlation coefficient (R) of 0.059 and weighted average of 59.2%, a difference of 7.5%.
Family Households Correlation Summary
| Measurement | Immigrants from Europe | Immigrants from Congo |
| Minimum | 25.9% | 35.2% |
| Maximum | 100.0% | 79.8% |
| Range | 74.1% | 44.6% |
| Mean | 68.1% | 58.9% |
| Median | 64.7% | 59.0% |
| Interquartile 25% (IQ1) | 62.2% | 56.1% |
| Interquartile 75% (IQ3) | 72.5% | 62.2% |
| Interquartile Range (IQR) | 10.2% | 6.1% |
| Standard Deviation (Sample) | 16.6% | 7.7% |
| Standard Deviation (Population) | 16.5% | 7.6% |
Similar Demographics by Family Households
Demographics Similar to Immigrants from Europe by Family Households
In terms of family households, the demographic groups most similar to Immigrants from Europe are Macedonian (63.7%, a difference of 0.010%), Immigrants from South Africa (63.7%, a difference of 0.020%), Osage (63.7%, a difference of 0.030%), Marshallese (63.7%, a difference of 0.030%), and Croatian (63.8%, a difference of 0.050%).
| Demographics | Rating | Rank | Family Households |
| Immigrants | Northern Europe | 8.8 /100 | #213 | Tragic 63.8% |
| Celtics | 8.0 /100 | #214 | Tragic 63.8% |
| Belgians | 7.6 /100 | #215 | Tragic 63.8% |
| Croatians | 7.3 /100 | #216 | Tragic 63.8% |
| Osage | 7.0 /100 | #217 | Tragic 63.7% |
| Marshallese | 6.9 /100 | #218 | Tragic 63.7% |
| Macedonians | 6.5 /100 | #219 | Tragic 63.7% |
| Immigrants | Europe | 6.4 /100 | #220 | Tragic 63.7% |
| Immigrants | South Africa | 5.9 /100 | #221 | Tragic 63.7% |
| Immigrants | Belarus | 5.5 /100 | #222 | Tragic 63.7% |
| French Canadians | 5.4 /100 | #223 | Tragic 63.7% |
| Turks | 4.5 /100 | #224 | Tragic 63.6% |
| Immigrants | Hungary | 4.3 /100 | #225 | Tragic 63.6% |
| Immigrants | Bahamas | 4.2 /100 | #226 | Tragic 63.6% |
| Trinidadians and Tobagonians | 4.1 /100 | #227 | Tragic 63.6% |
Demographics Similar to Immigrants from Congo by Family Households
In terms of family households, the demographic groups most similar to Immigrants from Congo are Immigrants from Zaire (59.2%, a difference of 0.14%), Senegalese (59.8%, a difference of 0.97%), Sudanese (60.0%, a difference of 1.3%), Immigrants from Senegal (60.1%, a difference of 1.5%), and Immigrants from Sudan (60.2%, a difference of 1.5%).
| Demographics | Rating | Rank | Family Households |
| Immigrants | Ethiopia | 0.0 /100 | #333 | Tragic 61.2% |
| Immigrants | Eastern Africa | 0.0 /100 | #334 | Tragic 61.1% |
| Carpatho Rusyns | 0.0 /100 | #335 | Tragic 61.1% |
| German Russians | 0.0 /100 | #336 | Tragic 60.9% |
| Soviet Union | 0.0 /100 | #337 | Tragic 60.9% |
| Immigrants | Eritrea | 0.0 /100 | #338 | Tragic 60.8% |
| Immigrants | Saudi Arabia | 0.0 /100 | #339 | Tragic 60.7% |
| Immigrants | Sudan | 0.0 /100 | #340 | Tragic 60.2% |
| Immigrants | Senegal | 0.0 /100 | #341 | Tragic 60.1% |
| Sudanese | 0.0 /100 | #342 | Tragic 60.0% |
| Senegalese | 0.0 /100 | #343 | Tragic 59.8% |
| Immigrants | Congo | 0.0 /100 | #344 | Tragic 59.2% |
| Immigrants | Zaire | 0.0 /100 | #345 | Tragic 59.2% |
| Somalis | 0.0 /100 | #346 | Tragic 57.6% |
| Immigrants | Somalia | 0.0 /100 | #347 | Tragic 56.7% |