Immigrants from Europe vs Immigrants from Vietnam Self-Care Disability
COMPARE
Immigrants from Europe
Immigrants from Vietnam
Self-Care Disability
Self-Care Disability Comparison
Immigrants from Europe
Immigrants from Vietnam
2.4%
SELF-CARE DISABILITY
69.6/ 100
METRIC RATING
157th/ 347
METRIC RANK
2.5%
SELF-CARE DISABILITY
59.3/ 100
METRIC RATING
164th/ 347
METRIC RANK
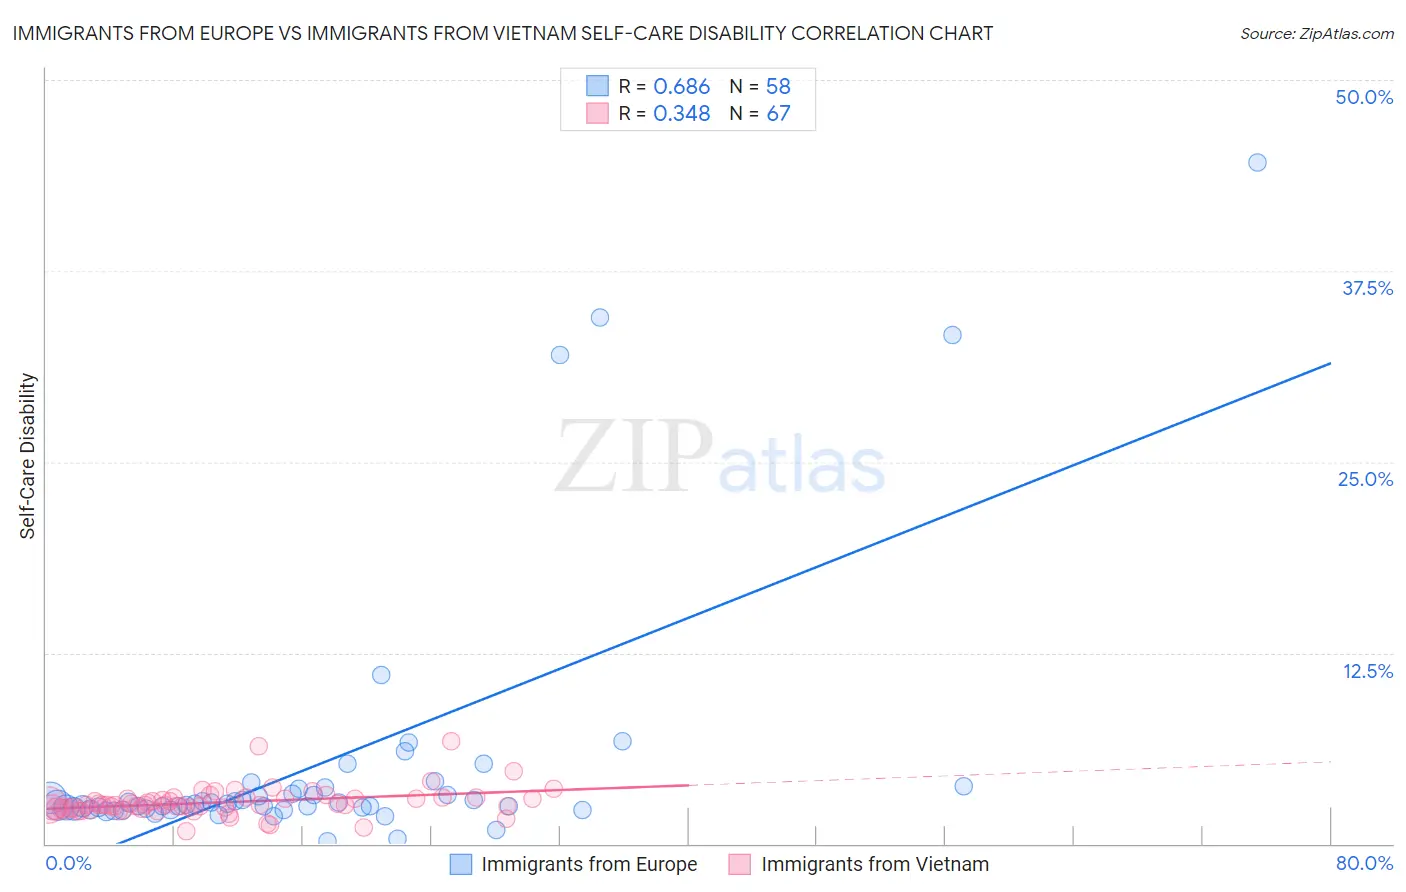
Immigrants from Europe vs Immigrants from Vietnam Self-Care Disability Correlation Chart
The statistical analysis conducted on geographies consisting of 545,734,078 people shows a significant positive correlation between the proportion of Immigrants from Europe and percentage of population with self-care disability in the United States with a correlation coefficient (R) of 0.686 and weighted average of 2.4%. Similarly, the statistical analysis conducted on geographies consisting of 404,358,280 people shows a mild positive correlation between the proportion of Immigrants from Vietnam and percentage of population with self-care disability in the United States with a correlation coefficient (R) of 0.348 and weighted average of 2.5%, a difference of 0.54%.
Self-Care Disability Correlation Summary
| Measurement | Immigrants from Europe | Immigrants from Vietnam |
| Minimum | 0.20% | 0.78% |
| Maximum | 44.6% | 6.7% |
| Range | 44.4% | 5.9% |
| Mean | 5.3% | 2.7% |
| Median | 2.6% | 2.5% |
| Interquartile 25% (IQ1) | 2.3% | 2.3% |
| Interquartile 75% (IQ3) | 3.6% | 3.0% |
| Interquartile Range (IQR) | 1.3% | 0.66% |
| Standard Deviation (Sample) | 8.7% | 0.94% |
| Standard Deviation (Population) | 8.6% | 0.93% |
Demographics Similar to Immigrants from Europe and Immigrants from Vietnam by Self-Care Disability
In terms of self-care disability, the demographic groups most similar to Immigrants from Europe are Nigerian (2.4%, a difference of 0.060%), Immigrants from Western Europe (2.4%, a difference of 0.060%), Immigrants from Italy (2.4%, a difference of 0.060%), Pakistani (2.4%, a difference of 0.11%), and Finnish (2.4%, a difference of 0.14%). Similarly, the demographic groups most similar to Immigrants from Vietnam are Syrian (2.5%, a difference of 0.020%), Canadian (2.5%, a difference of 0.030%), Immigrants from Greece (2.5%, a difference of 0.10%), Ute (2.5%, a difference of 0.11%), and German Russian (2.5%, a difference of 0.17%).
| Demographics | Rating | Rank | Self-Care Disability |
| Immigrants | Costa Rica | 75.1 /100 | #150 | Good 2.4% |
| Basques | 74.0 /100 | #151 | Good 2.4% |
| Tlingit-Haida | 73.5 /100 | #152 | Good 2.4% |
| Immigrants | England | 73.5 /100 | #153 | Good 2.4% |
| Italians | 72.2 /100 | #154 | Good 2.4% |
| Pakistanis | 71.4 /100 | #155 | Good 2.4% |
| Nigerians | 70.6 /100 | #156 | Good 2.4% |
| Immigrants | Europe | 69.6 /100 | #157 | Good 2.4% |
| Immigrants | Western Europe | 68.6 /100 | #158 | Good 2.4% |
| Immigrants | Italy | 68.5 /100 | #159 | Good 2.4% |
| Finns | 67.0 /100 | #160 | Good 2.4% |
| Lebanese | 66.5 /100 | #161 | Good 2.4% |
| Somalis | 63.7 /100 | #162 | Good 2.5% |
| German Russians | 62.7 /100 | #163 | Good 2.5% |
| Immigrants | Vietnam | 59.3 /100 | #164 | Average 2.5% |
| Syrians | 59.0 /100 | #165 | Average 2.5% |
| Canadians | 58.8 /100 | #166 | Average 2.5% |
| Immigrants | Greece | 57.3 /100 | #167 | Average 2.5% |
| Ute | 57.1 /100 | #168 | Average 2.5% |
| Immigrants | Somalia | 55.9 /100 | #169 | Average 2.5% |
| Scottish | 54.3 /100 | #170 | Average 2.5% |