Immigrants from Ethiopia vs Immigrants from Congo Self-Care Disability
COMPARE
Immigrants from Ethiopia
Immigrants from Congo
Self-Care Disability
Self-Care Disability Comparison
Immigrants from Ethiopia
Immigrants from Congo
2.2%
SELF-CARE DISABILITY
100.0/ 100
METRIC RATING
12th/ 347
METRIC RANK
2.4%
SELF-CARE DISABILITY
98.0/ 100
METRIC RATING
89th/ 347
METRIC RANK
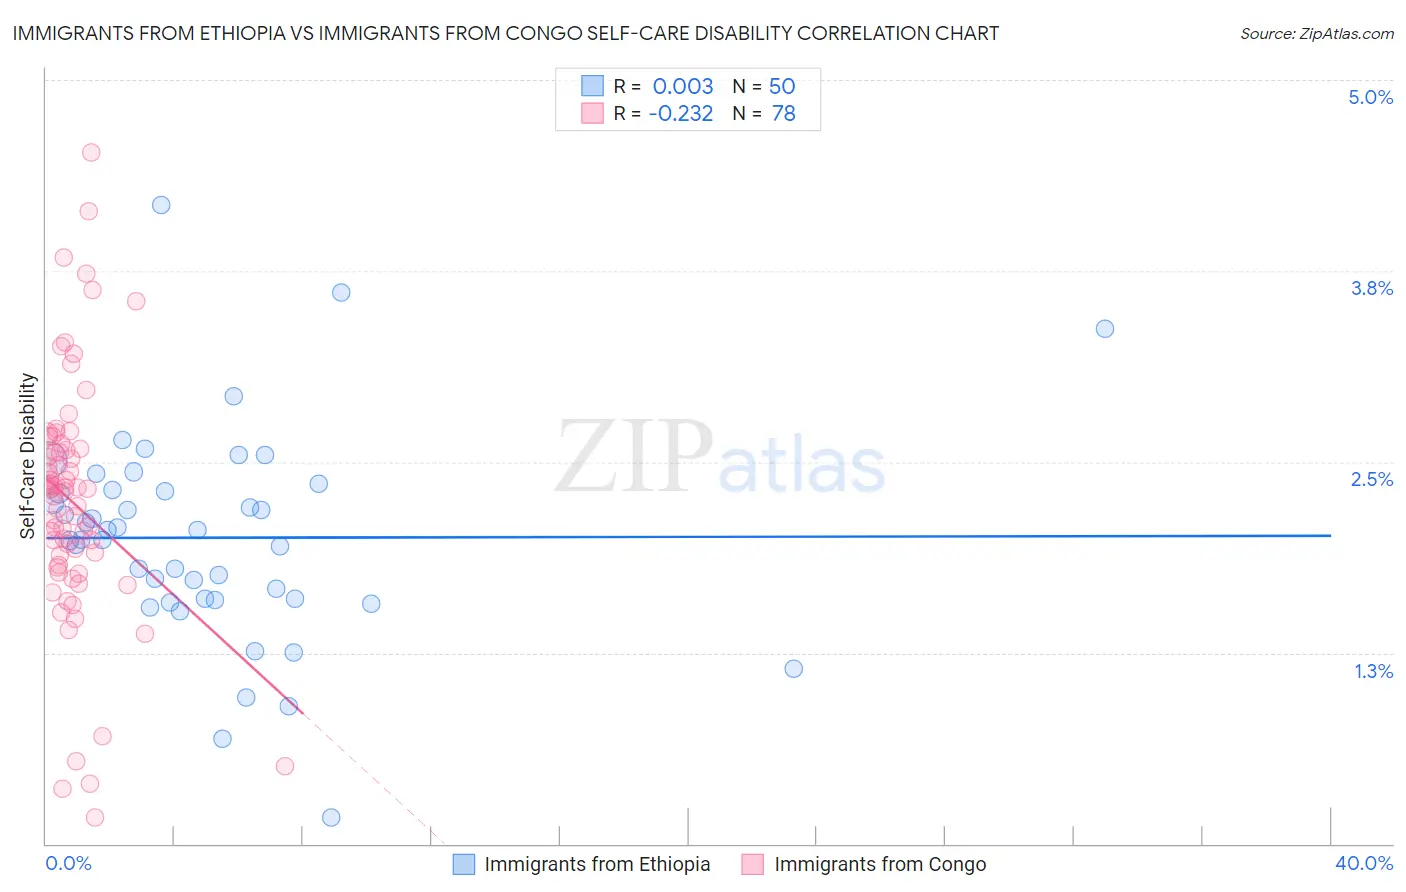
Immigrants from Ethiopia vs Immigrants from Congo Self-Care Disability Correlation Chart
The statistical analysis conducted on geographies consisting of 211,457,724 people shows no correlation between the proportion of Immigrants from Ethiopia and percentage of population with self-care disability in the United States with a correlation coefficient (R) of 0.003 and weighted average of 2.2%. Similarly, the statistical analysis conducted on geographies consisting of 92,100,672 people shows a weak negative correlation between the proportion of Immigrants from Congo and percentage of population with self-care disability in the United States with a correlation coefficient (R) of -0.232 and weighted average of 2.4%, a difference of 7.2%.
Self-Care Disability Correlation Summary
| Measurement | Immigrants from Ethiopia | Immigrants from Congo |
| Minimum | 0.17% | 0.17% |
| Maximum | 4.2% | 4.5% |
| Range | 4.0% | 4.4% |
| Mean | 2.0% | 2.2% |
| Median | 2.0% | 2.3% |
| Interquartile 25% (IQ1) | 1.6% | 1.8% |
| Interquartile 75% (IQ3) | 2.3% | 2.6% |
| Interquartile Range (IQR) | 0.71% | 0.76% |
| Standard Deviation (Sample) | 0.69% | 0.81% |
| Standard Deviation (Population) | 0.69% | 0.80% |
Similar Demographics by Self-Care Disability
Demographics Similar to Immigrants from Ethiopia by Self-Care Disability
In terms of self-care disability, the demographic groups most similar to Immigrants from Ethiopia are Ethiopian (2.2%, a difference of 0.010%), Immigrants from South Central Asia (2.2%, a difference of 0.050%), Sudanese (2.2%, a difference of 0.16%), Luxembourger (2.2%, a difference of 0.17%), and Okinawan (2.2%, a difference of 0.18%).
| Demographics | Rating | Rank | Self-Care Disability |
| Zimbabweans | 100.0 /100 | #5 | Exceptional 2.2% |
| Filipinos | 100.0 /100 | #6 | Exceptional 2.2% |
| Immigrants | Bolivia | 100.0 /100 | #7 | Exceptional 2.2% |
| Bolivians | 100.0 /100 | #8 | Exceptional 2.2% |
| Immigrants | Nepal | 100.0 /100 | #9 | Exceptional 2.2% |
| Sudanese | 100.0 /100 | #10 | Exceptional 2.2% |
| Immigrants | South Central Asia | 100.0 /100 | #11 | Exceptional 2.2% |
| Immigrants | Ethiopia | 100.0 /100 | #12 | Exceptional 2.2% |
| Ethiopians | 100.0 /100 | #13 | Exceptional 2.2% |
| Luxembourgers | 100.0 /100 | #14 | Exceptional 2.2% |
| Okinawans | 100.0 /100 | #15 | Exceptional 2.2% |
| Immigrants | Kuwait | 100.0 /100 | #16 | Exceptional 2.2% |
| Immigrants | Saudi Arabia | 100.0 /100 | #17 | Exceptional 2.2% |
| Immigrants | Taiwan | 100.0 /100 | #18 | Exceptional 2.2% |
| Immigrants | Eritrea | 100.0 /100 | #19 | Exceptional 2.2% |
Demographics Similar to Immigrants from Congo by Self-Care Disability
In terms of self-care disability, the demographic groups most similar to Immigrants from Congo are Sierra Leonean (2.4%, a difference of 0.050%), Lithuanian (2.4%, a difference of 0.050%), Immigrants from Czechoslovakia (2.4%, a difference of 0.14%), Immigrants from Jordan (2.4%, a difference of 0.15%), and Immigrants from Northern Africa (2.3%, a difference of 0.19%).
| Demographics | Rating | Rank | Self-Care Disability |
| Immigrants | Denmark | 98.8 /100 | #82 | Exceptional 2.3% |
| Indians (Asian) | 98.7 /100 | #83 | Exceptional 2.3% |
| Immigrants | Spain | 98.7 /100 | #84 | Exceptional 2.3% |
| Estonians | 98.3 /100 | #85 | Exceptional 2.3% |
| Immigrants | Northern Africa | 98.2 /100 | #86 | Exceptional 2.3% |
| Sierra Leoneans | 98.0 /100 | #87 | Exceptional 2.4% |
| Lithuanians | 98.0 /100 | #88 | Exceptional 2.4% |
| Immigrants | Congo | 98.0 /100 | #89 | Exceptional 2.4% |
| Immigrants | Czechoslovakia | 97.7 /100 | #90 | Exceptional 2.4% |
| Immigrants | Jordan | 97.7 /100 | #91 | Exceptional 2.4% |
| Icelanders | 97.4 /100 | #92 | Exceptional 2.4% |
| Immigrants | Latvia | 97.0 /100 | #93 | Exceptional 2.4% |
| Macedonians | 96.9 /100 | #94 | Exceptional 2.4% |
| Immigrants | Asia | 96.9 /100 | #95 | Exceptional 2.4% |
| Immigrants | Chile | 96.7 /100 | #96 | Exceptional 2.4% |