Immigrants from Ecuador vs Mongolian Male Disability
COMPARE
Immigrants from Ecuador
Mongolian
Male Disability
Male Disability Comparison
Immigrants from Ecuador
Mongolians
10.4%
MALE DISABILITY
99.3/ 100
METRIC RATING
62nd/ 347
METRIC RANK
10.3%
MALE DISABILITY
99.7/ 100
METRIC RATING
42nd/ 347
METRIC RANK
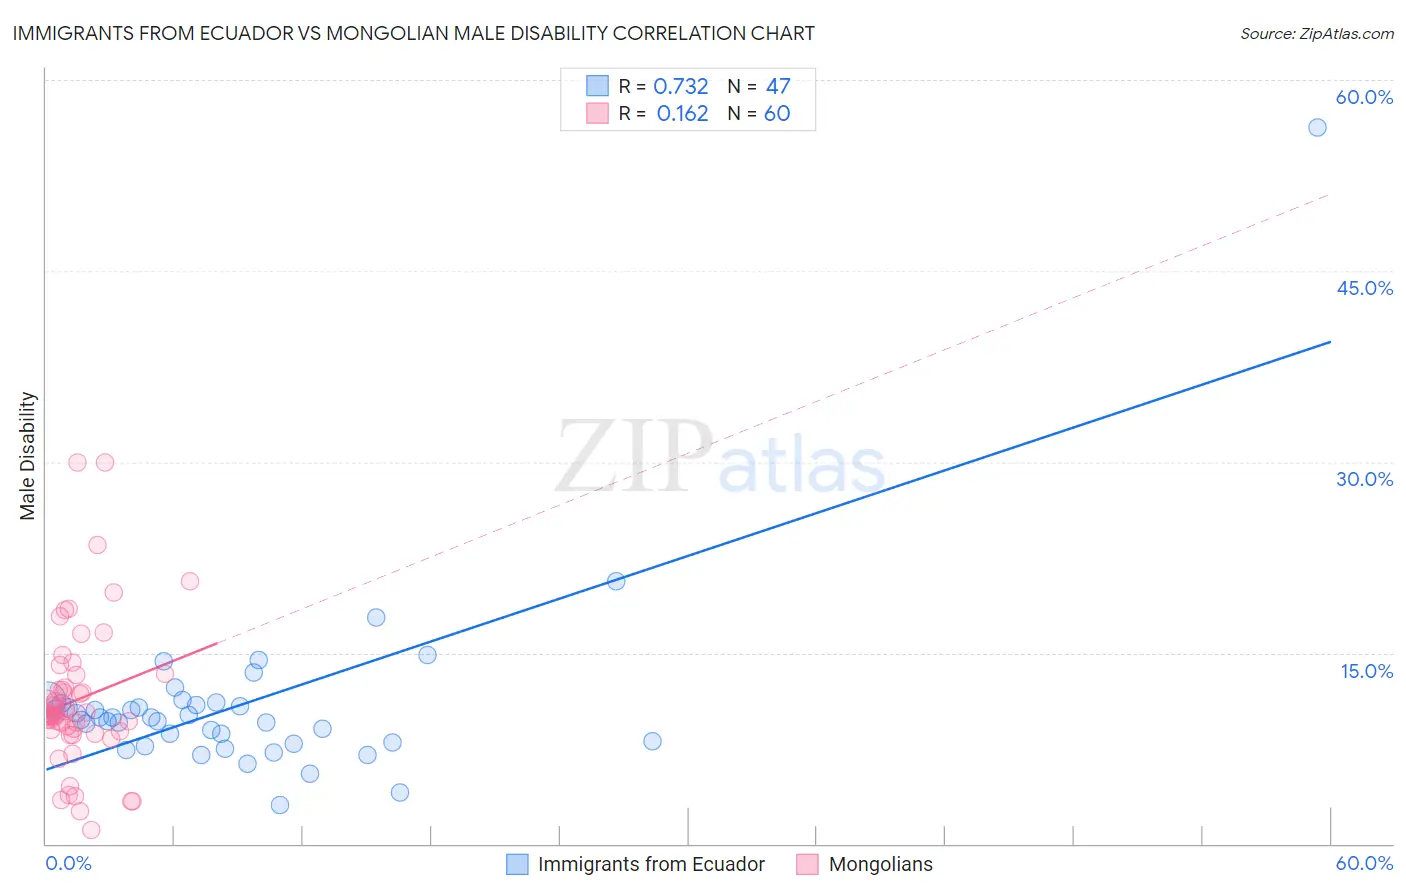
Immigrants from Ecuador vs Mongolian Male Disability Correlation Chart
The statistical analysis conducted on geographies consisting of 270,973,645 people shows a strong positive correlation between the proportion of Immigrants from Ecuador and percentage of males with a disability in the United States with a correlation coefficient (R) of 0.732 and weighted average of 10.4%. Similarly, the statistical analysis conducted on geographies consisting of 140,361,312 people shows a poor positive correlation between the proportion of Mongolians and percentage of males with a disability in the United States with a correlation coefficient (R) of 0.162 and weighted average of 10.3%, a difference of 1.4%.
Male Disability Correlation Summary
| Measurement | Immigrants from Ecuador | Mongolian |
| Minimum | 3.0% | 1.1% |
| Maximum | 56.2% | 30.0% |
| Range | 53.3% | 28.9% |
| Mean | 10.9% | 11.3% |
| Median | 9.9% | 10.1% |
| Interquartile 25% (IQ1) | 8.0% | 8.9% |
| Interquartile 75% (IQ3) | 11.0% | 12.8% |
| Interquartile Range (IQR) | 3.1% | 3.9% |
| Standard Deviation (Sample) | 7.4% | 5.7% |
| Standard Deviation (Population) | 7.4% | 5.6% |
Demographics Similar to Immigrants from Ecuador and Mongolians by Male Disability
In terms of male disability, the demographic groups most similar to Immigrants from Ecuador are Immigrants from Northern Africa (10.4%, a difference of 0.26%), Immigrants from Colombia (10.4%, a difference of 0.36%), Immigrants from Australia (10.4%, a difference of 0.42%), Immigrants from Japan (10.4%, a difference of 0.56%), and Immigrants from South America (10.4%, a difference of 0.64%). Similarly, the demographic groups most similar to Mongolians are Immigrants from Bangladesh (10.3%, a difference of 0.020%), Immigrants from El Salvador (10.3%, a difference of 0.090%), Turkish (10.3%, a difference of 0.10%), Cambodian (10.3%, a difference of 0.18%), and Immigrants from Peru (10.3%, a difference of 0.22%).
| Demographics | Rating | Rank | Male Disability |
| Mongolians | 99.7 /100 | #42 | Exceptional 10.3% |
| Immigrants | Bangladesh | 99.7 /100 | #43 | Exceptional 10.3% |
| Immigrants | El Salvador | 99.7 /100 | #44 | Exceptional 10.3% |
| Turks | 99.7 /100 | #45 | Exceptional 10.3% |
| Cambodians | 99.7 /100 | #46 | Exceptional 10.3% |
| Immigrants | Peru | 99.7 /100 | #47 | Exceptional 10.3% |
| Israelis | 99.7 /100 | #48 | Exceptional 10.3% |
| Immigrants | Spain | 99.7 /100 | #49 | Exceptional 10.3% |
| South Americans | 99.6 /100 | #50 | Exceptional 10.3% |
| Salvadorans | 99.6 /100 | #51 | Exceptional 10.4% |
| Immigrants | Saudi Arabia | 99.6 /100 | #52 | Exceptional 10.4% |
| Immigrants | Uzbekistan | 99.6 /100 | #53 | Exceptional 10.4% |
| Peruvians | 99.6 /100 | #54 | Exceptional 10.4% |
| Immigrants | Eritrea | 99.6 /100 | #55 | Exceptional 10.4% |
| Tongans | 99.6 /100 | #56 | Exceptional 10.4% |
| Immigrants | South America | 99.6 /100 | #57 | Exceptional 10.4% |
| Immigrants | Japan | 99.5 /100 | #58 | Exceptional 10.4% |
| Immigrants | Australia | 99.5 /100 | #59 | Exceptional 10.4% |
| Immigrants | Colombia | 99.5 /100 | #60 | Exceptional 10.4% |
| Immigrants | Northern Africa | 99.4 /100 | #61 | Exceptional 10.4% |
| Immigrants | Ecuador | 99.3 /100 | #62 | Exceptional 10.4% |