Immigrants from Ecuador vs Immigrants from Jordan Male Disability
COMPARE
Immigrants from Ecuador
Immigrants from Jordan
Male Disability
Male Disability Comparison
Immigrants from Ecuador
Immigrants from Jordan
10.4%
MALE DISABILITY
99.3/ 100
METRIC RATING
62nd/ 347
METRIC RANK
10.6%
MALE DISABILITY
98.4/ 100
METRIC RATING
80th/ 347
METRIC RANK
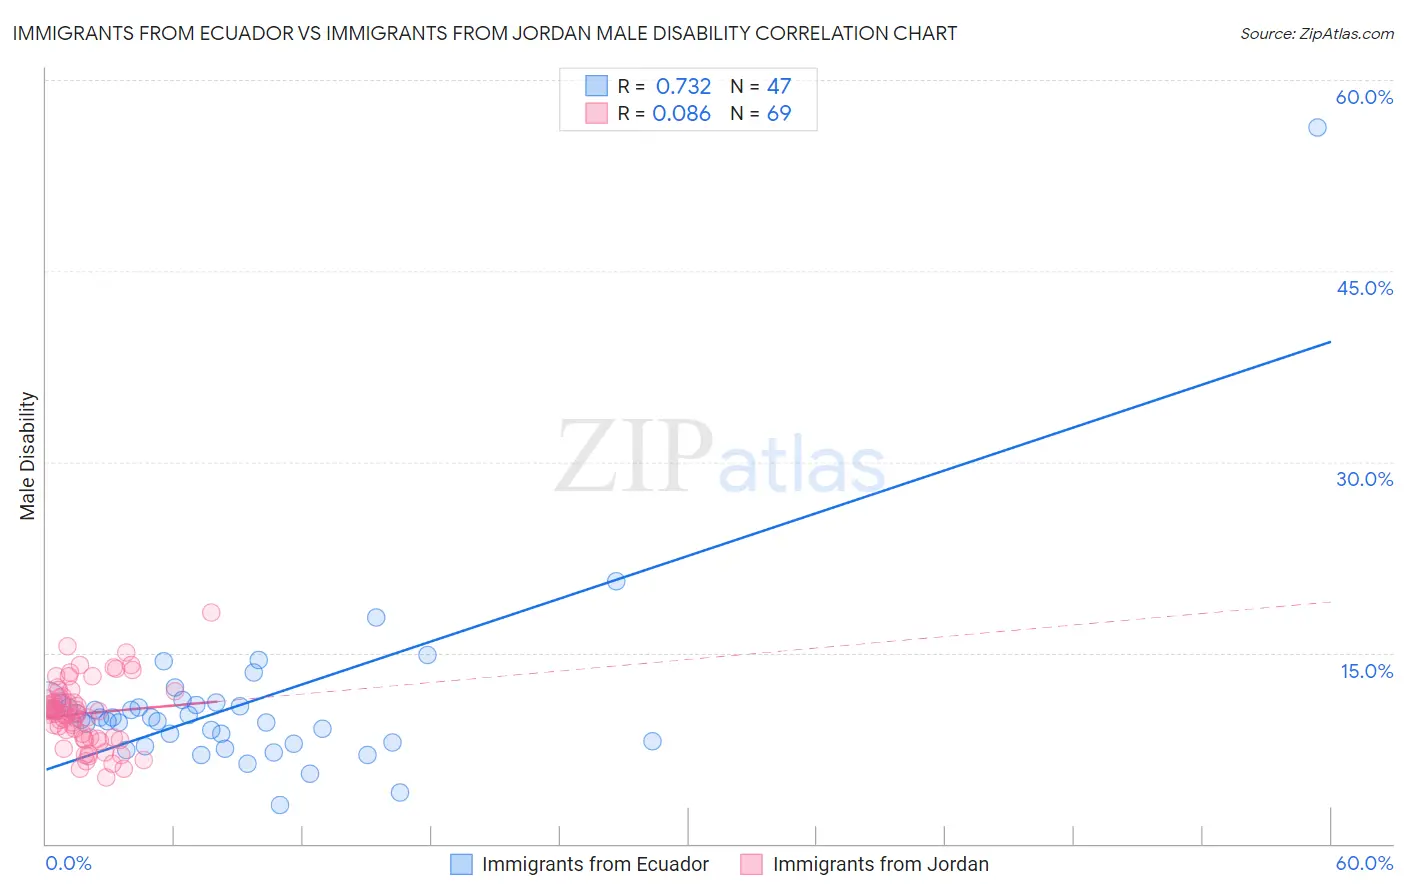
Immigrants from Ecuador vs Immigrants from Jordan Male Disability Correlation Chart
The statistical analysis conducted on geographies consisting of 270,973,645 people shows a strong positive correlation between the proportion of Immigrants from Ecuador and percentage of males with a disability in the United States with a correlation coefficient (R) of 0.732 and weighted average of 10.4%. Similarly, the statistical analysis conducted on geographies consisting of 181,276,340 people shows a slight positive correlation between the proportion of Immigrants from Jordan and percentage of males with a disability in the United States with a correlation coefficient (R) of 0.086 and weighted average of 10.6%, a difference of 1.3%.
Male Disability Correlation Summary
| Measurement | Immigrants from Ecuador | Immigrants from Jordan |
| Minimum | 3.0% | 5.2% |
| Maximum | 56.2% | 18.2% |
| Range | 53.3% | 13.0% |
| Mean | 10.9% | 10.2% |
| Median | 9.9% | 10.2% |
| Interquartile 25% (IQ1) | 8.0% | 8.3% |
| Interquartile 75% (IQ3) | 11.0% | 11.5% |
| Interquartile Range (IQR) | 3.1% | 3.2% |
| Standard Deviation (Sample) | 7.4% | 2.5% |
| Standard Deviation (Population) | 7.4% | 2.5% |
Demographics Similar to Immigrants from Ecuador and Immigrants from Jordan by Male Disability
In terms of male disability, the demographic groups most similar to Immigrants from Ecuador are Immigrants from Belarus (10.4%, a difference of 0.020%), Jordanian (10.5%, a difference of 0.15%), Immigrants from Grenada (10.5%, a difference of 0.17%), Guyanese (10.5%, a difference of 0.17%), and Immigrants from Afghanistan (10.5%, a difference of 0.18%). Similarly, the demographic groups most similar to Immigrants from Jordan are Zimbabwean (10.6%, a difference of 0.020%), Immigrants from Chile (10.6%, a difference of 0.060%), Immigrants from Russia (10.6%, a difference of 0.25%), Laotian (10.6%, a difference of 0.27%), and Immigrants from Sierra Leone (10.5%, a difference of 0.33%).
| Demographics | Rating | Rank | Male Disability |
| Immigrants | Northern Africa | 99.4 /100 | #61 | Exceptional 10.4% |
| Immigrants | Ecuador | 99.3 /100 | #62 | Exceptional 10.4% |
| Immigrants | Belarus | 99.3 /100 | #63 | Exceptional 10.4% |
| Jordanians | 99.3 /100 | #64 | Exceptional 10.5% |
| Immigrants | Grenada | 99.2 /100 | #65 | Exceptional 10.5% |
| Guyanese | 99.2 /100 | #66 | Exceptional 10.5% |
| Immigrants | Afghanistan | 99.2 /100 | #67 | Exceptional 10.5% |
| Colombians | 99.2 /100 | #68 | Exceptional 10.5% |
| Ecuadorians | 99.2 /100 | #69 | Exceptional 10.5% |
| Immigrants | Bulgaria | 99.1 /100 | #70 | Exceptional 10.5% |
| Immigrants | Cameroon | 99.0 /100 | #71 | Exceptional 10.5% |
| Immigrants | Serbia | 99.0 /100 | #72 | Exceptional 10.5% |
| Immigrants | Lithuania | 98.9 /100 | #73 | Exceptional 10.5% |
| Immigrants | Lebanon | 98.8 /100 | #74 | Exceptional 10.5% |
| Sierra Leoneans | 98.7 /100 | #75 | Exceptional 10.5% |
| Immigrants | Sierra Leone | 98.7 /100 | #76 | Exceptional 10.5% |
| Laotians | 98.6 /100 | #77 | Exceptional 10.6% |
| Immigrants | Russia | 98.6 /100 | #78 | Exceptional 10.6% |
| Zimbabweans | 98.4 /100 | #79 | Exceptional 10.6% |
| Immigrants | Jordan | 98.4 /100 | #80 | Exceptional 10.6% |
| Immigrants | Chile | 98.3 /100 | #81 | Exceptional 10.6% |