Immigrants from Ecuador vs Greek 4th Grade
COMPARE
Immigrants from Ecuador
Greek
4th Grade
4th Grade Comparison
Immigrants from Ecuador
Greeks
96.2%
4TH GRADE
0.0/ 100
METRIC RATING
316th/ 347
METRIC RANK
98.1%
4TH GRADE
99.8/ 100
METRIC RATING
56th/ 347
METRIC RANK
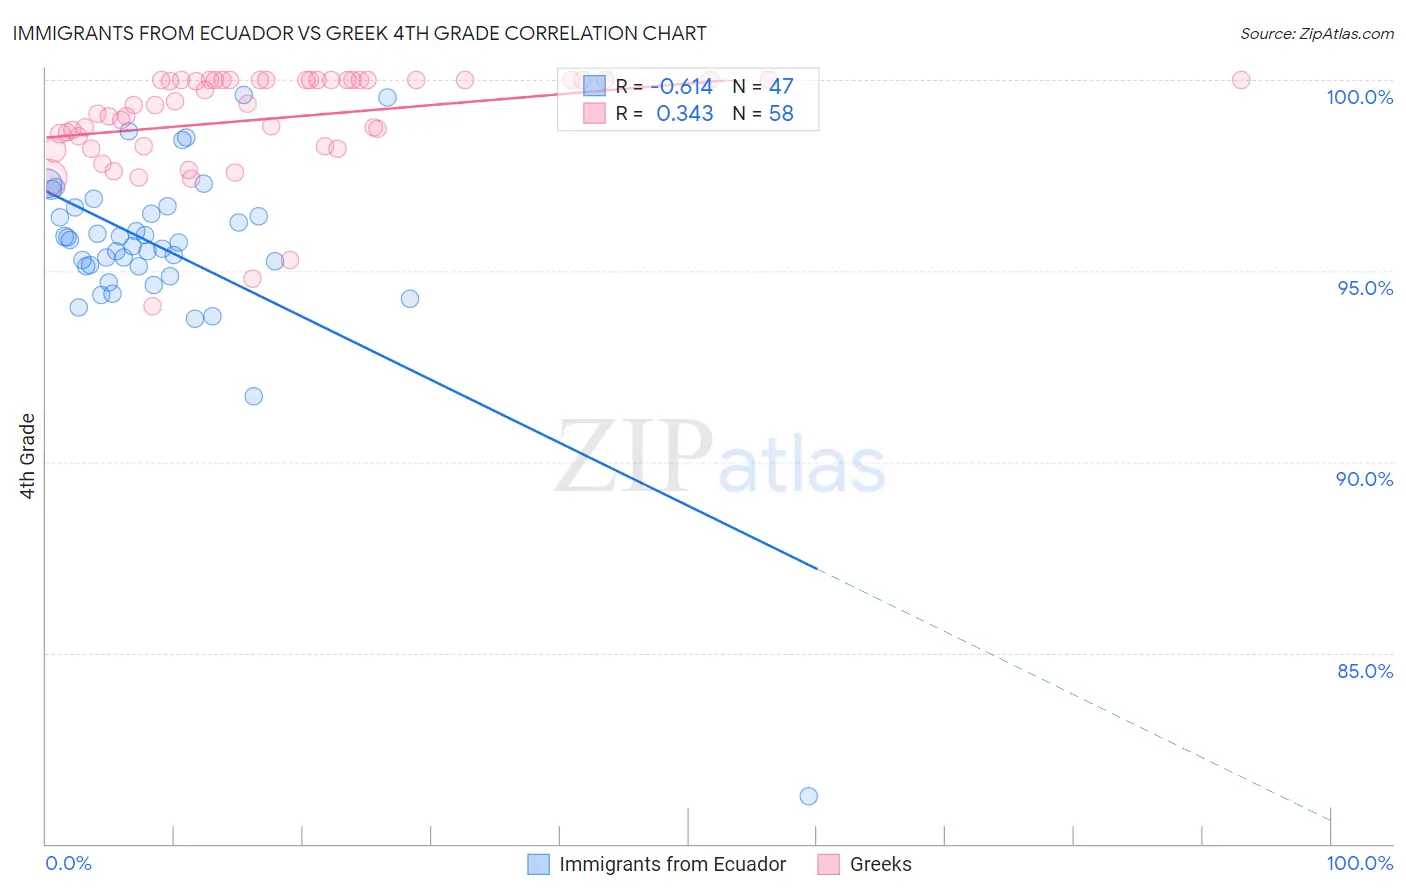
Immigrants from Ecuador vs Greek 4th Grade Correlation Chart
The statistical analysis conducted on geographies consisting of 271,020,679 people shows a significant negative correlation between the proportion of Immigrants from Ecuador and percentage of population with at least 4th grade education in the United States with a correlation coefficient (R) of -0.614 and weighted average of 96.2%. Similarly, the statistical analysis conducted on geographies consisting of 482,775,358 people shows a mild positive correlation between the proportion of Greeks and percentage of population with at least 4th grade education in the United States with a correlation coefficient (R) of 0.343 and weighted average of 98.1%, a difference of 1.9%.
4th Grade Correlation Summary
| Measurement | Immigrants from Ecuador | Greek |
| Minimum | 81.2% | 94.1% |
| Maximum | 99.6% | 100.0% |
| Range | 18.3% | 5.9% |
| Mean | 95.6% | 99.0% |
| Median | 95.8% | 99.4% |
| Interquartile 25% (IQ1) | 95.1% | 98.3% |
| Interquartile 75% (IQ3) | 96.7% | 100.0% |
| Interquartile Range (IQR) | 1.6% | 1.7% |
| Standard Deviation (Sample) | 2.6% | 1.3% |
| Standard Deviation (Population) | 2.6% | 1.3% |
Similar Demographics by 4th Grade
Demographics Similar to Immigrants from Ecuador by 4th Grade
In terms of 4th grade, the demographic groups most similar to Immigrants from Ecuador are Indonesian (96.2%, a difference of 0.010%), Vietnamese (96.2%, a difference of 0.010%), Nicaraguan (96.2%, a difference of 0.010%), Cape Verdean (96.2%, a difference of 0.030%), and Immigrants from Bangladesh (96.2%, a difference of 0.040%).
| Demographics | Rating | Rank | 4th Grade |
| Immigrants | Guyana | 0.0 /100 | #309 | Tragic 96.3% |
| Immigrants | Burma/Myanmar | 0.0 /100 | #310 | Tragic 96.3% |
| Immigrants | Bangladesh | 0.0 /100 | #311 | Tragic 96.2% |
| Cape Verdeans | 0.0 /100 | #312 | Tragic 96.2% |
| Indonesians | 0.0 /100 | #313 | Tragic 96.2% |
| Vietnamese | 0.0 /100 | #314 | Tragic 96.2% |
| Nicaraguans | 0.0 /100 | #315 | Tragic 96.2% |
| Immigrants | Ecuador | 0.0 /100 | #316 | Tragic 96.2% |
| Central American Indians | 0.0 /100 | #317 | Tragic 96.2% |
| Immigrants | Azores | 0.0 /100 | #318 | Tragic 96.1% |
| Belizeans | 0.0 /100 | #319 | Tragic 96.1% |
| Bangladeshis | 0.0 /100 | #320 | Tragic 96.1% |
| Japanese | 0.0 /100 | #321 | Tragic 96.0% |
| Immigrants | Vietnam | 0.0 /100 | #322 | Tragic 96.0% |
| Immigrants | Nicaragua | 0.0 /100 | #323 | Tragic 96.0% |
Demographics Similar to Greeks by 4th Grade
In terms of 4th grade, the demographic groups most similar to Greeks are Maltese (98.1%, a difference of 0.0%), White/Caucasian (98.1%, a difference of 0.0%), Austrian (98.1%, a difference of 0.0%), Creek (98.1%, a difference of 0.0%), and Celtic (98.1%, a difference of 0.010%).
| Demographics | Rating | Rank | 4th Grade |
| Bulgarians | 99.8 /100 | #49 | Exceptional 98.1% |
| Immigrants | Scotland | 99.8 /100 | #50 | Exceptional 98.1% |
| Celtics | 99.8 /100 | #51 | Exceptional 98.1% |
| Australians | 99.8 /100 | #52 | Exceptional 98.1% |
| Slavs | 99.8 /100 | #53 | Exceptional 98.1% |
| Maltese | 99.8 /100 | #54 | Exceptional 98.1% |
| Whites/Caucasians | 99.8 /100 | #55 | Exceptional 98.1% |
| Greeks | 99.8 /100 | #56 | Exceptional 98.1% |
| Austrians | 99.8 /100 | #57 | Exceptional 98.1% |
| Creek | 99.8 /100 | #58 | Exceptional 98.1% |
| Americans | 99.8 /100 | #59 | Exceptional 98.1% |
| Immigrants | Canada | 99.7 /100 | #60 | Exceptional 98.1% |
| Immigrants | North America | 99.7 /100 | #61 | Exceptional 98.1% |
| Serbians | 99.7 /100 | #62 | Exceptional 98.1% |
| Russians | 99.7 /100 | #63 | Exceptional 98.0% |