British vs Dominican Disability
COMPARE
British
Dominican
Disability
Disability Comparison
British
Dominicans
12.2%
DISABILITY
1.5/ 100
METRIC RATING
243rd/ 347
METRIC RANK
12.7%
DISABILITY
0.0/ 100
METRIC RATING
272nd/ 347
METRIC RANK
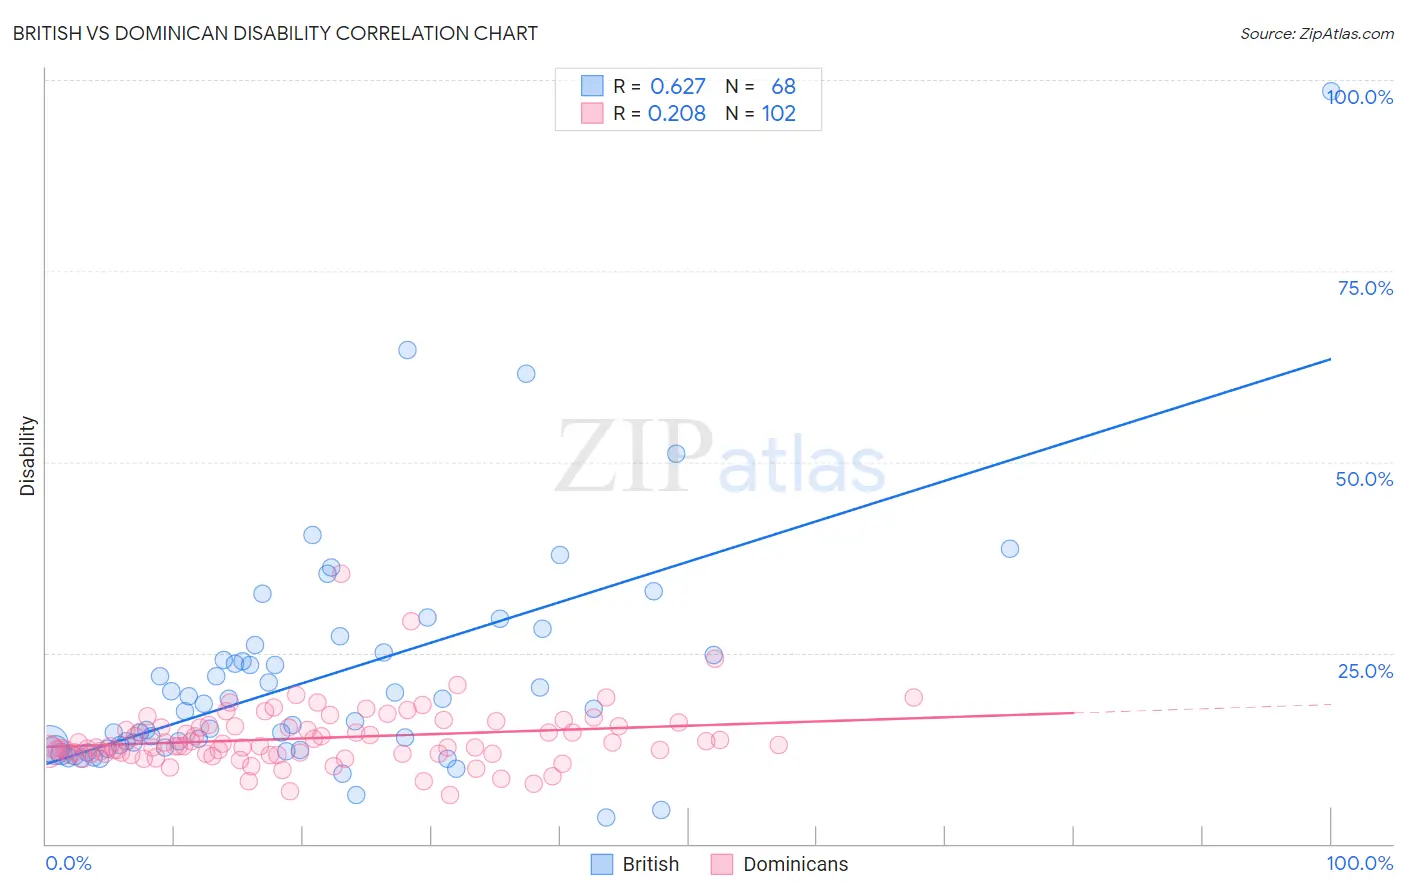
British vs Dominican Disability Correlation Chart
The statistical analysis conducted on geographies consisting of 531,410,774 people shows a significant positive correlation between the proportion of British and percentage of population with a disability in the United States with a correlation coefficient (R) of 0.627 and weighted average of 12.2%. Similarly, the statistical analysis conducted on geographies consisting of 355,062,868 people shows a weak positive correlation between the proportion of Dominicans and percentage of population with a disability in the United States with a correlation coefficient (R) of 0.208 and weighted average of 12.7%, a difference of 3.7%.
Disability Correlation Summary
| Measurement | British | Dominican |
| Minimum | 3.5% | 6.4% |
| Maximum | 98.5% | 35.3% |
| Range | 95.0% | 28.9% |
| Mean | 21.7% | 13.8% |
| Median | 17.5% | 12.8% |
| Interquartile 25% (IQ1) | 12.6% | 11.8% |
| Interquartile 75% (IQ3) | 24.8% | 15.3% |
| Interquartile Range (IQR) | 12.3% | 3.5% |
| Standard Deviation (Sample) | 15.1% | 4.0% |
| Standard Deviation (Population) | 15.0% | 4.0% |
Similar Demographics by Disability
Demographics Similar to British by Disability
In terms of disability, the demographic groups most similar to British are Basque (12.2%, a difference of 0.0%), Liberian (12.2%, a difference of 0.020%), Swiss (12.2%, a difference of 0.040%), Indonesian (12.2%, a difference of 0.070%), and Polish (12.2%, a difference of 0.090%).
| Demographics | Rating | Rank | Disability |
| Chinese | 2.0 /100 | #236 | Tragic 12.2% |
| Immigrants | Congo | 1.9 /100 | #237 | Tragic 12.2% |
| Norwegians | 1.9 /100 | #238 | Tragic 12.2% |
| Swedes | 1.8 /100 | #239 | Tragic 12.2% |
| Hungarians | 1.7 /100 | #240 | Tragic 12.2% |
| Yugoslavians | 1.7 /100 | #241 | Tragic 12.2% |
| Poles | 1.7 /100 | #242 | Tragic 12.2% |
| British | 1.5 /100 | #243 | Tragic 12.2% |
| Basques | 1.5 /100 | #244 | Tragic 12.2% |
| Liberians | 1.5 /100 | #245 | Tragic 12.2% |
| Swiss | 1.5 /100 | #246 | Tragic 12.2% |
| Indonesians | 1.4 /100 | #247 | Tragic 12.2% |
| Guamanians/Chamorros | 1.4 /100 | #248 | Tragic 12.3% |
| Carpatho Rusyns | 1.4 /100 | #249 | Tragic 12.3% |
| Sub-Saharan Africans | 1.4 /100 | #250 | Tragic 12.3% |
Demographics Similar to Dominicans by Disability
In terms of disability, the demographic groups most similar to Dominicans are Finnish (12.7%, a difference of 0.16%), Immigrants from Yemen (12.6%, a difference of 0.49%), Portuguese (12.6%, a difference of 0.54%), Nepalese (12.8%, a difference of 0.60%), and Sioux (12.8%, a difference of 0.68%).
| Demographics | Rating | Rank | Disability |
| U.S. Virgin Islanders | 0.2 /100 | #265 | Tragic 12.5% |
| Czechoslovakians | 0.2 /100 | #266 | Tragic 12.5% |
| Spaniards | 0.2 /100 | #267 | Tragic 12.5% |
| Bangladeshis | 0.1 /100 | #268 | Tragic 12.6% |
| Immigrants | Dominican Republic | 0.1 /100 | #269 | Tragic 12.6% |
| Portuguese | 0.1 /100 | #270 | Tragic 12.6% |
| Immigrants | Yemen | 0.1 /100 | #271 | Tragic 12.6% |
| Dominicans | 0.0 /100 | #272 | Tragic 12.7% |
| Finns | 0.0 /100 | #273 | Tragic 12.7% |
| Nepalese | 0.0 /100 | #274 | Tragic 12.8% |
| Sioux | 0.0 /100 | #275 | Tragic 12.8% |
| Hmong | 0.0 /100 | #276 | Tragic 12.8% |
| Dutch | 0.0 /100 | #277 | Tragic 12.8% |
| Germans | 0.0 /100 | #278 | Tragic 12.8% |
| Fijians | 0.0 /100 | #279 | Tragic 12.8% |